Proton Calorimetry/Experimental Runs/2017/September7
Beam tests of the Nuvia 10 mm, 4 mm and 3 mm scintillator sheets with PRaVDA CMOS pixel sensors (PRIAPUS) at the Birmingham Cyclotron with a 28 MeV beam.
Pre-data Taking Information and Notes
- The tests were carried out with an energy of 28 MeV (32 MeV was unavailable as the cyclotron had recently been through repairs). No Bragg Peak measurement was carried out to confirm the exact beam energy due to time restrictions.
- The beam was run without a scattering foil. A 1 cm diameter uniform beam was achieved by placing a 1 cm collimator in the beam, with a beam scan onto film confirming the size. An ionisation chamber was placed upstream of the collimator to accurately monitor the current.
- The dynamic range of the CMOS sensors is 14 bits. The electron conversion value from ADC is 50 electrons per ADC value. The measurements to establish this were carried out at the beginning of experimentation with the sensors and this value may have changed due to radiation damage etc.
- From previous measurements, the average background value per pixel is ~ 700.
- The data was recorded at 45 frames/second.
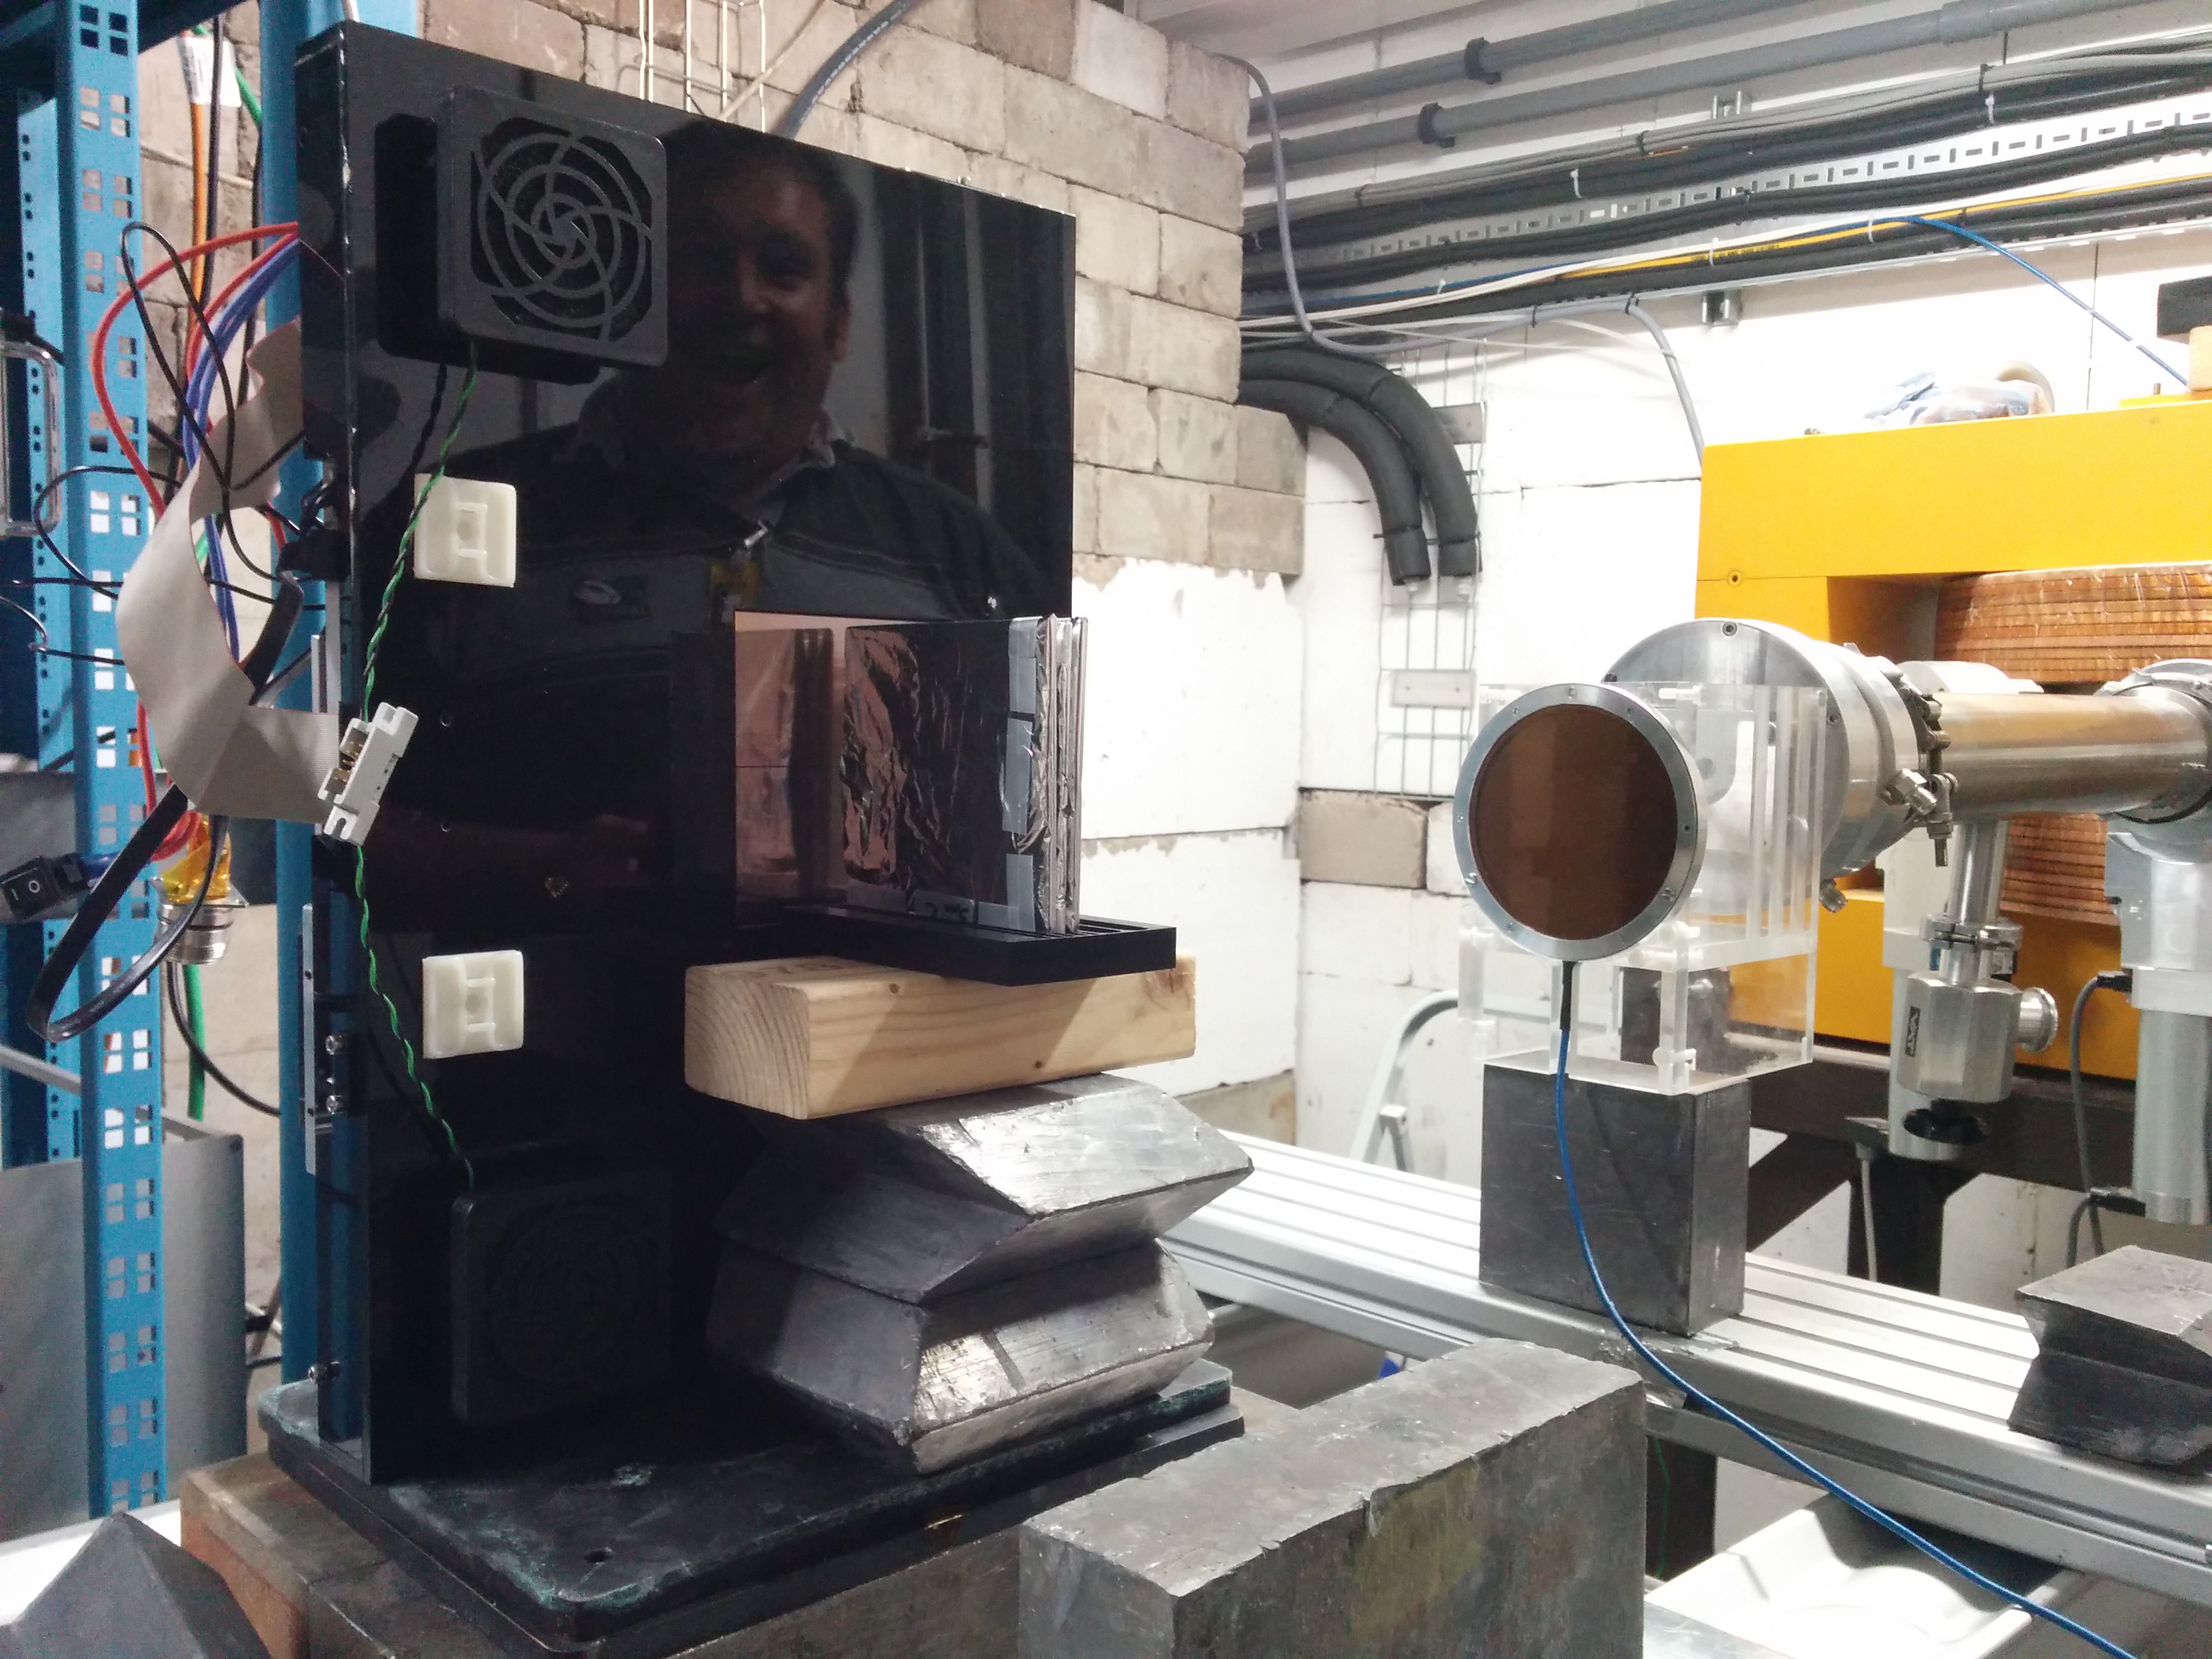
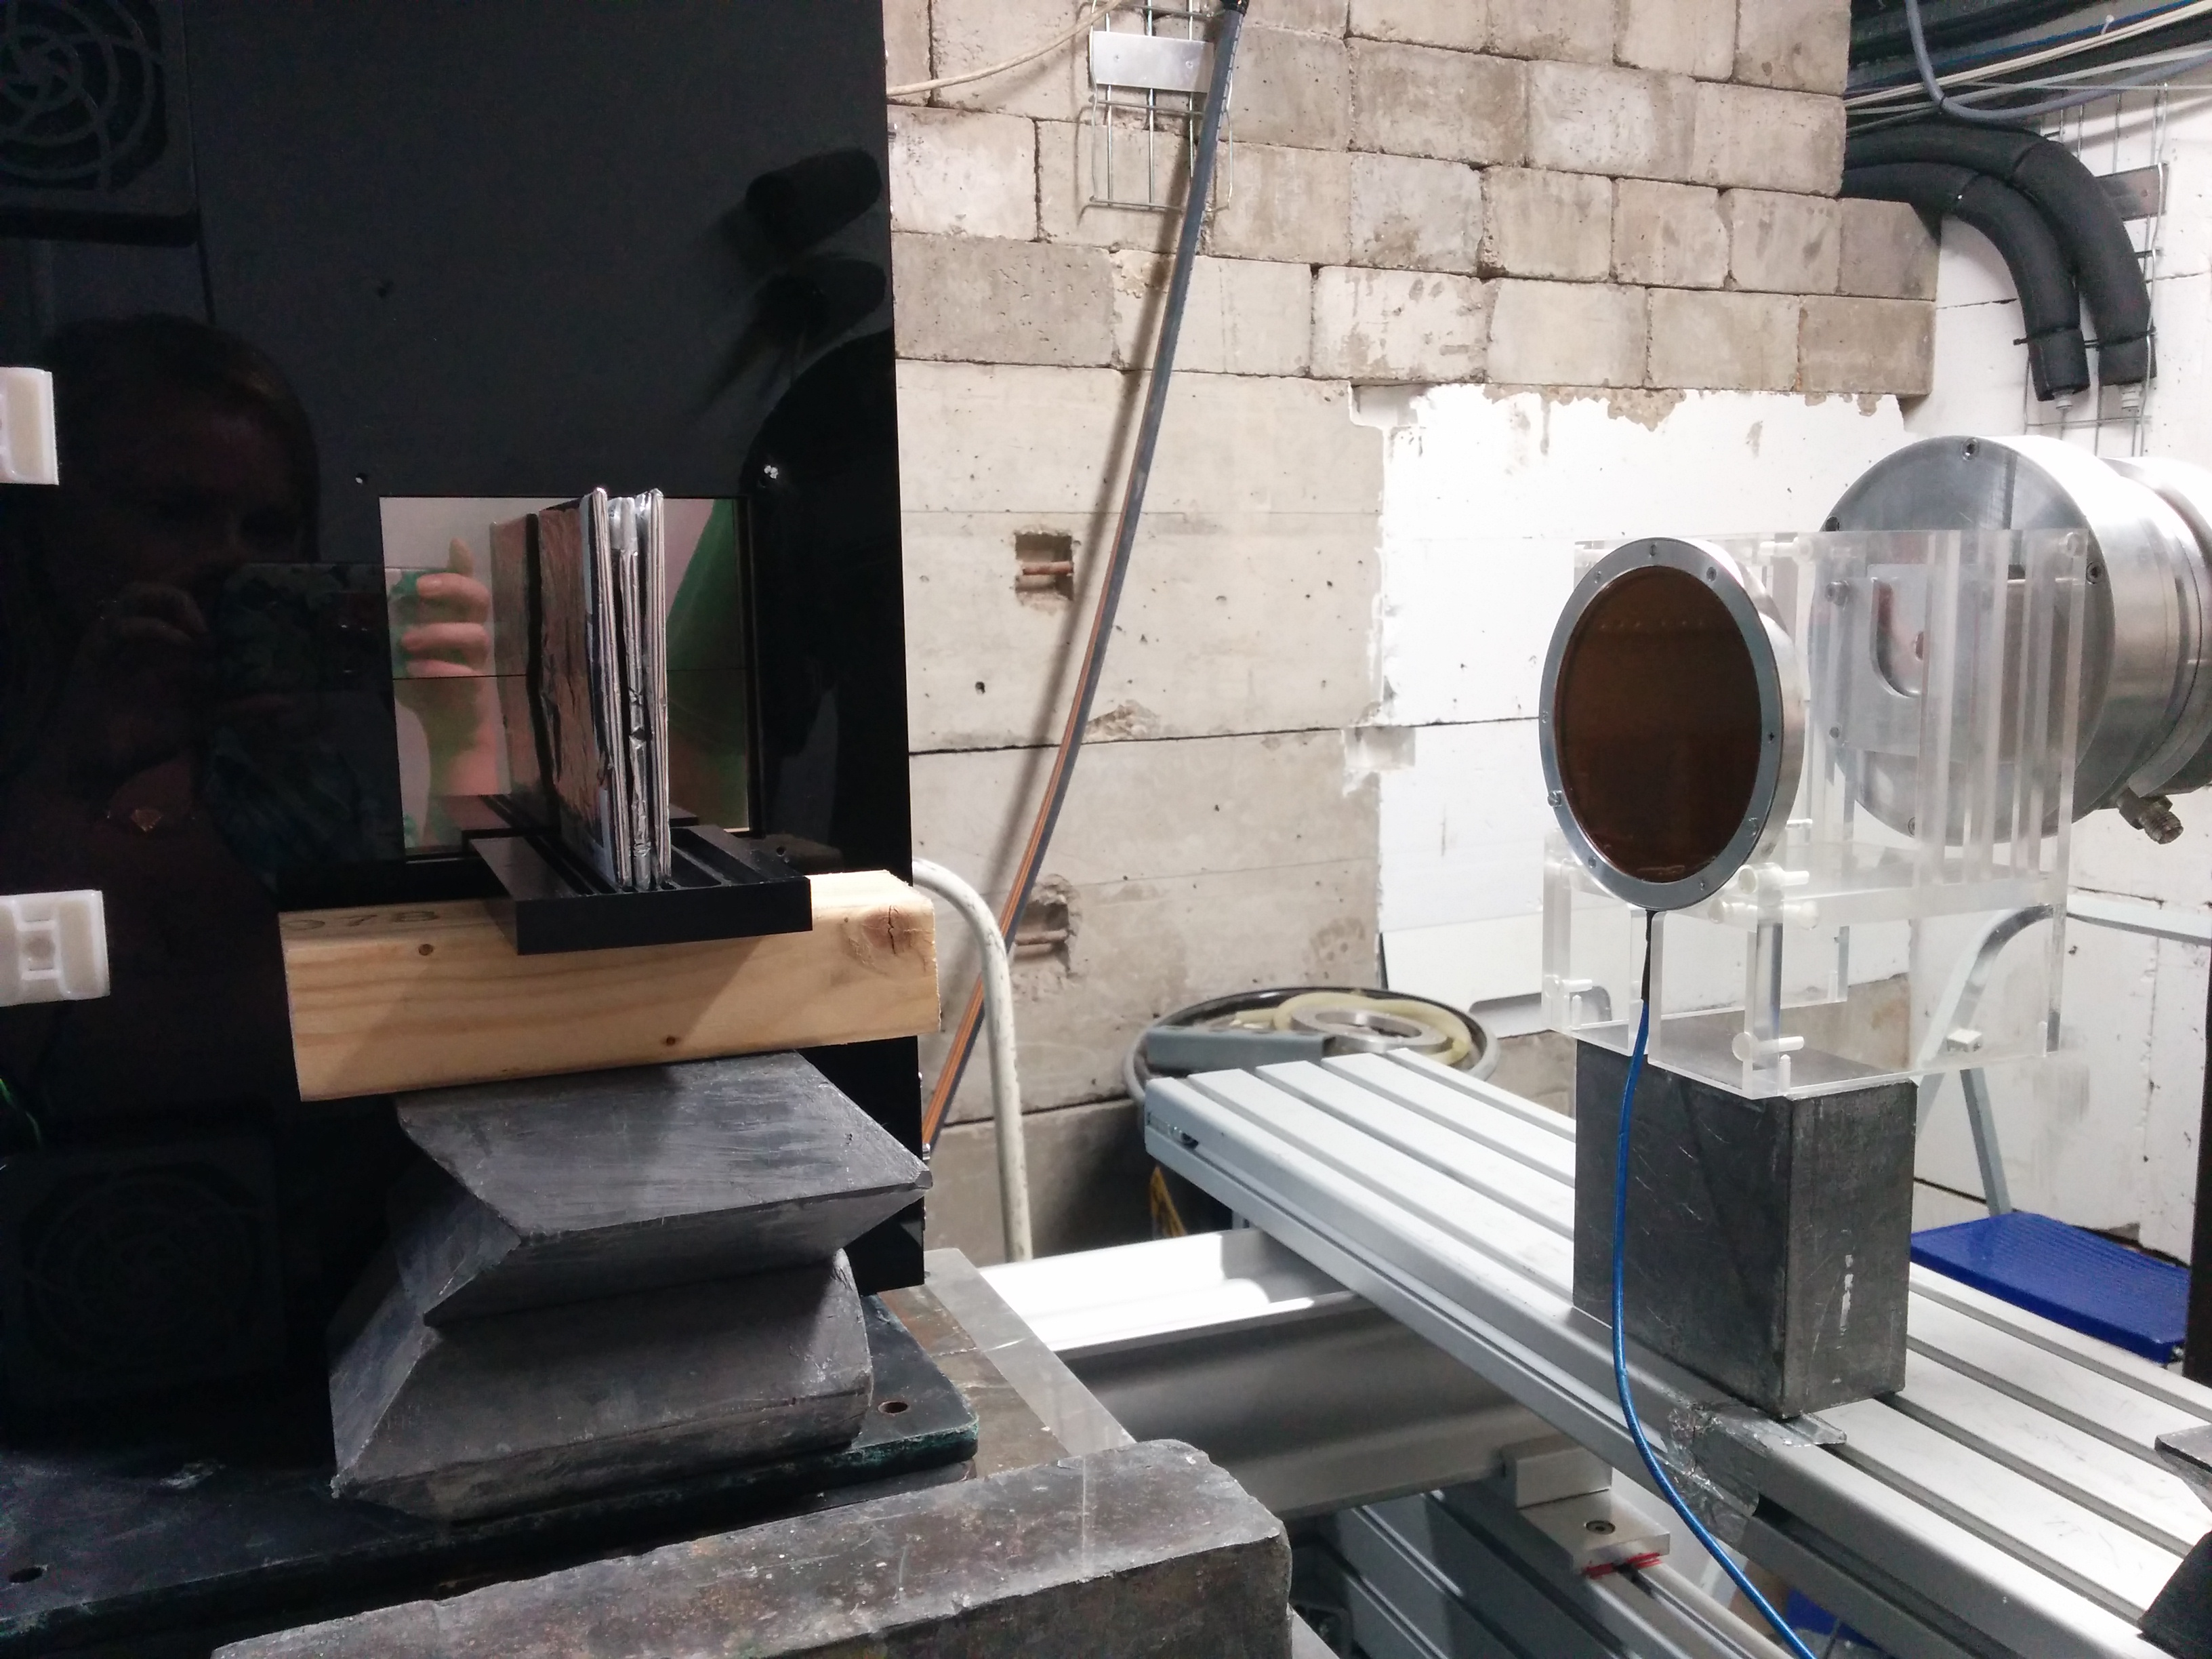
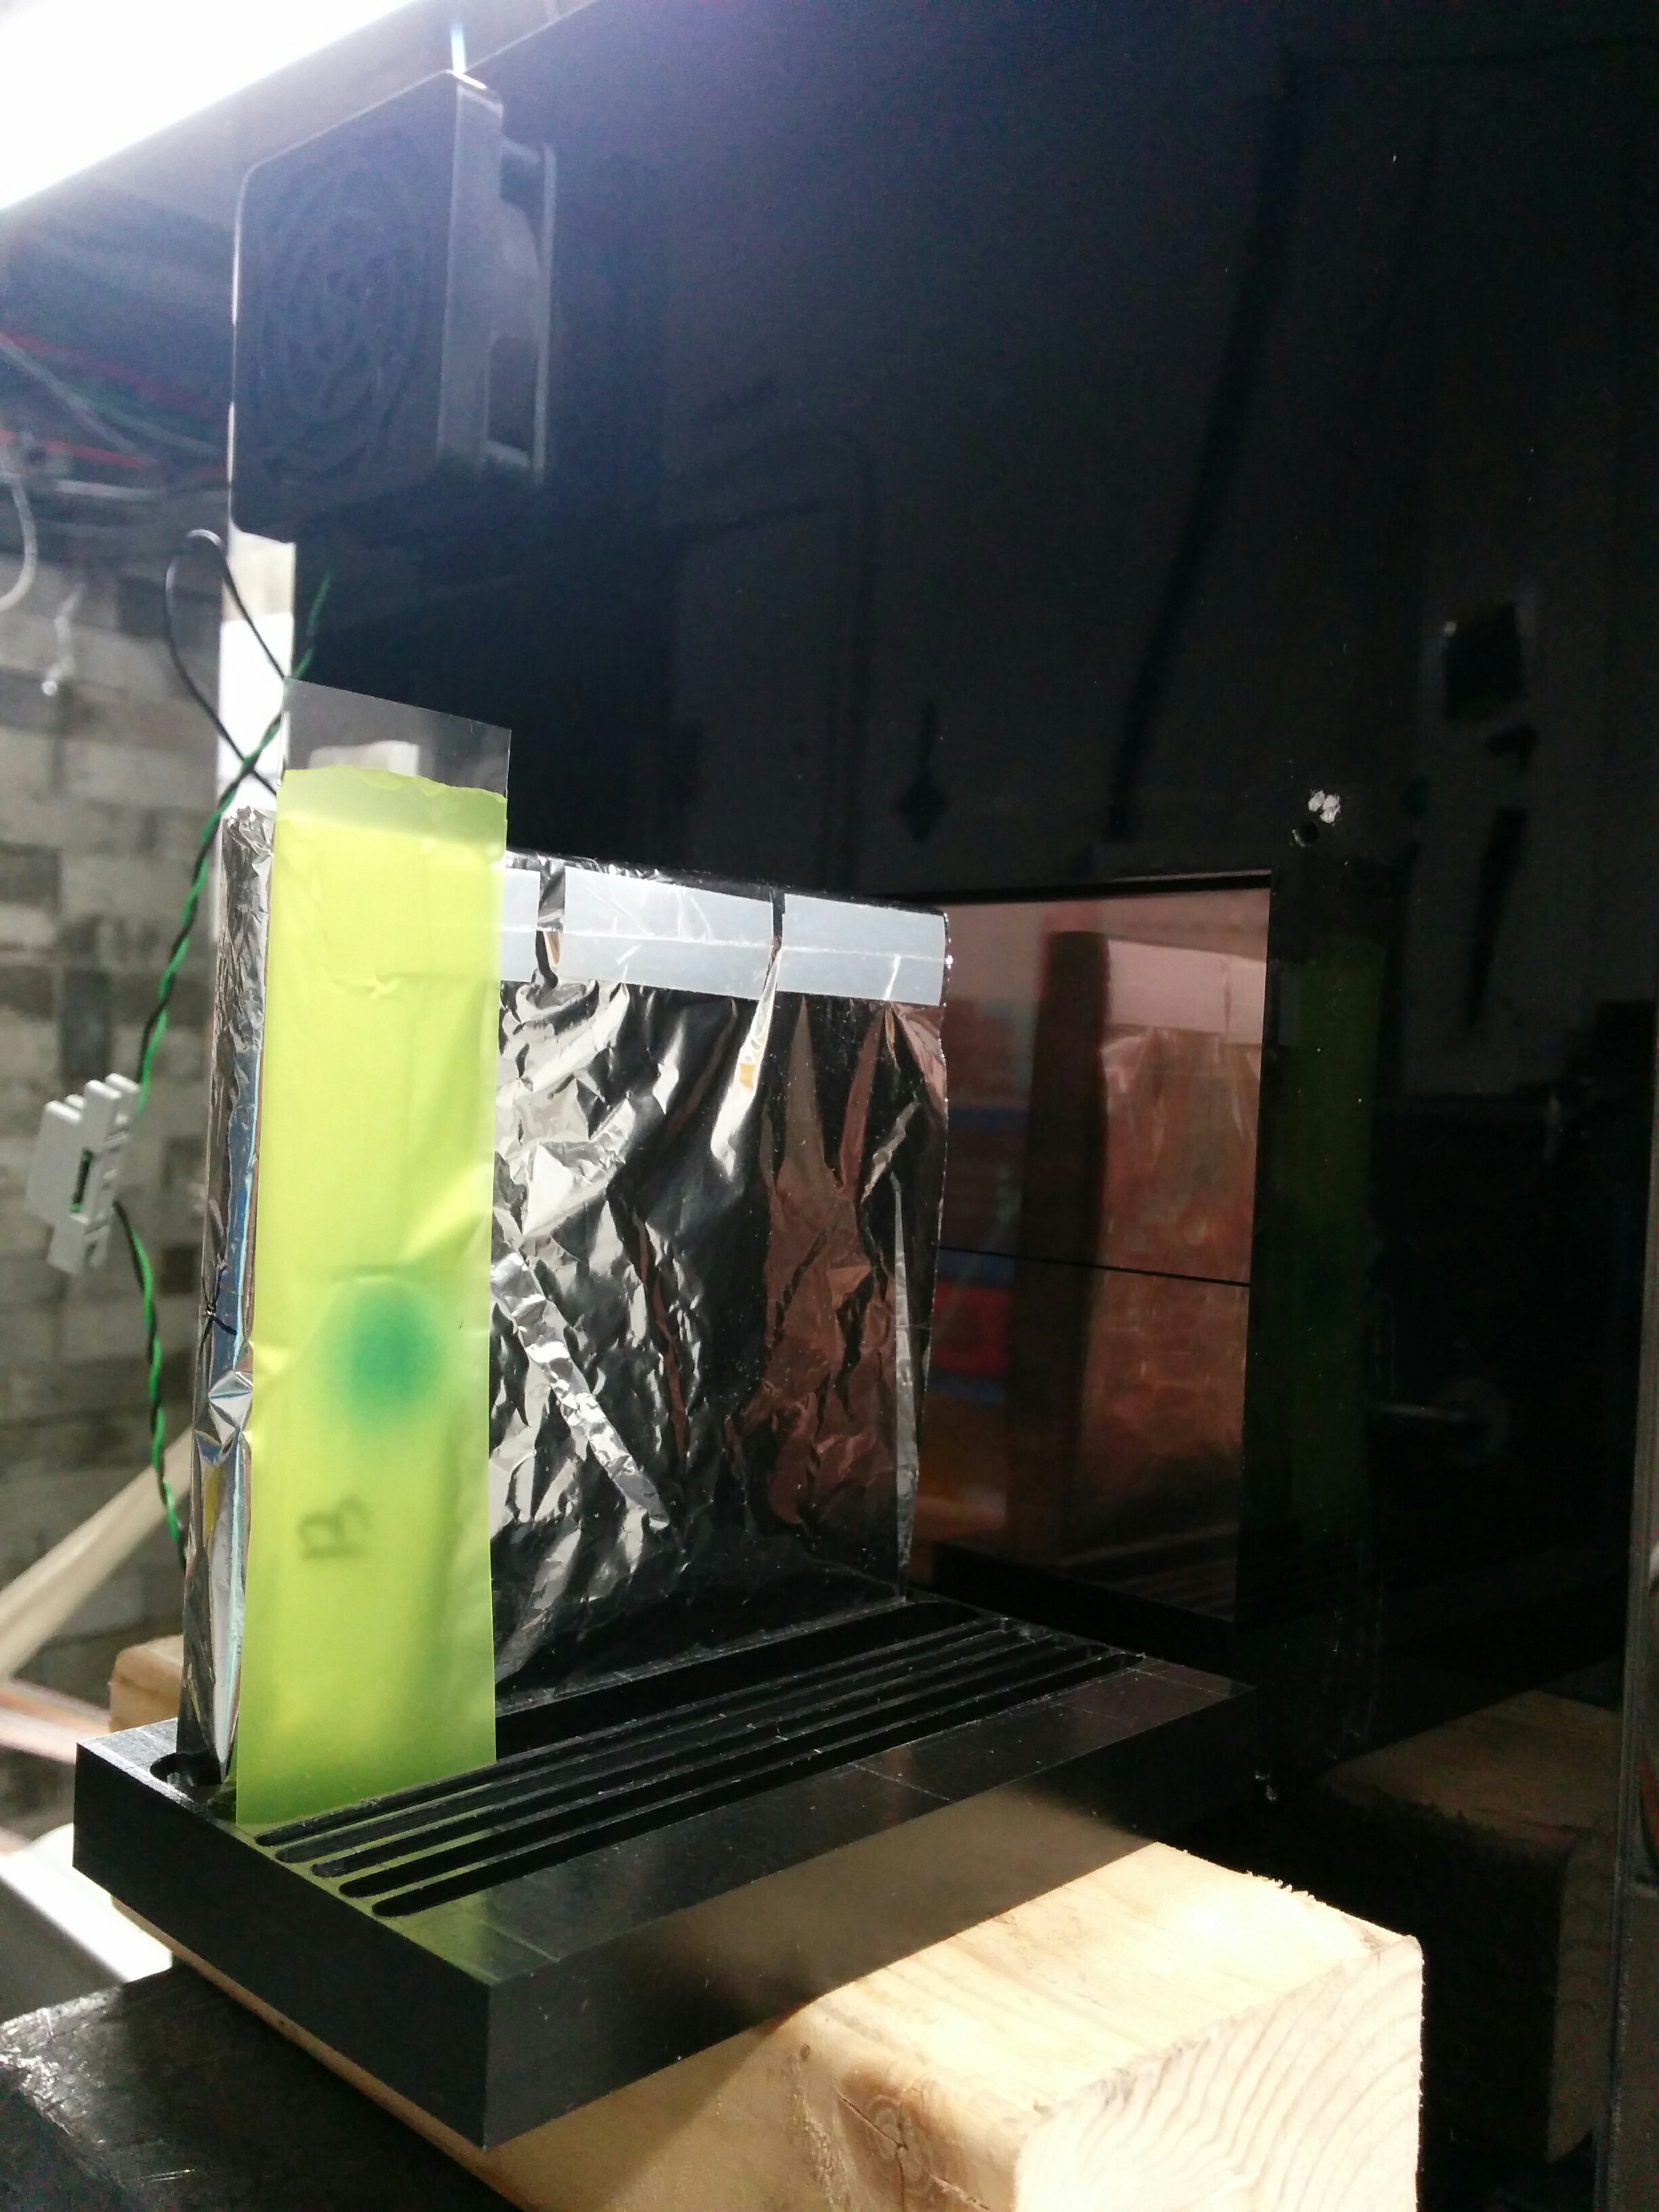
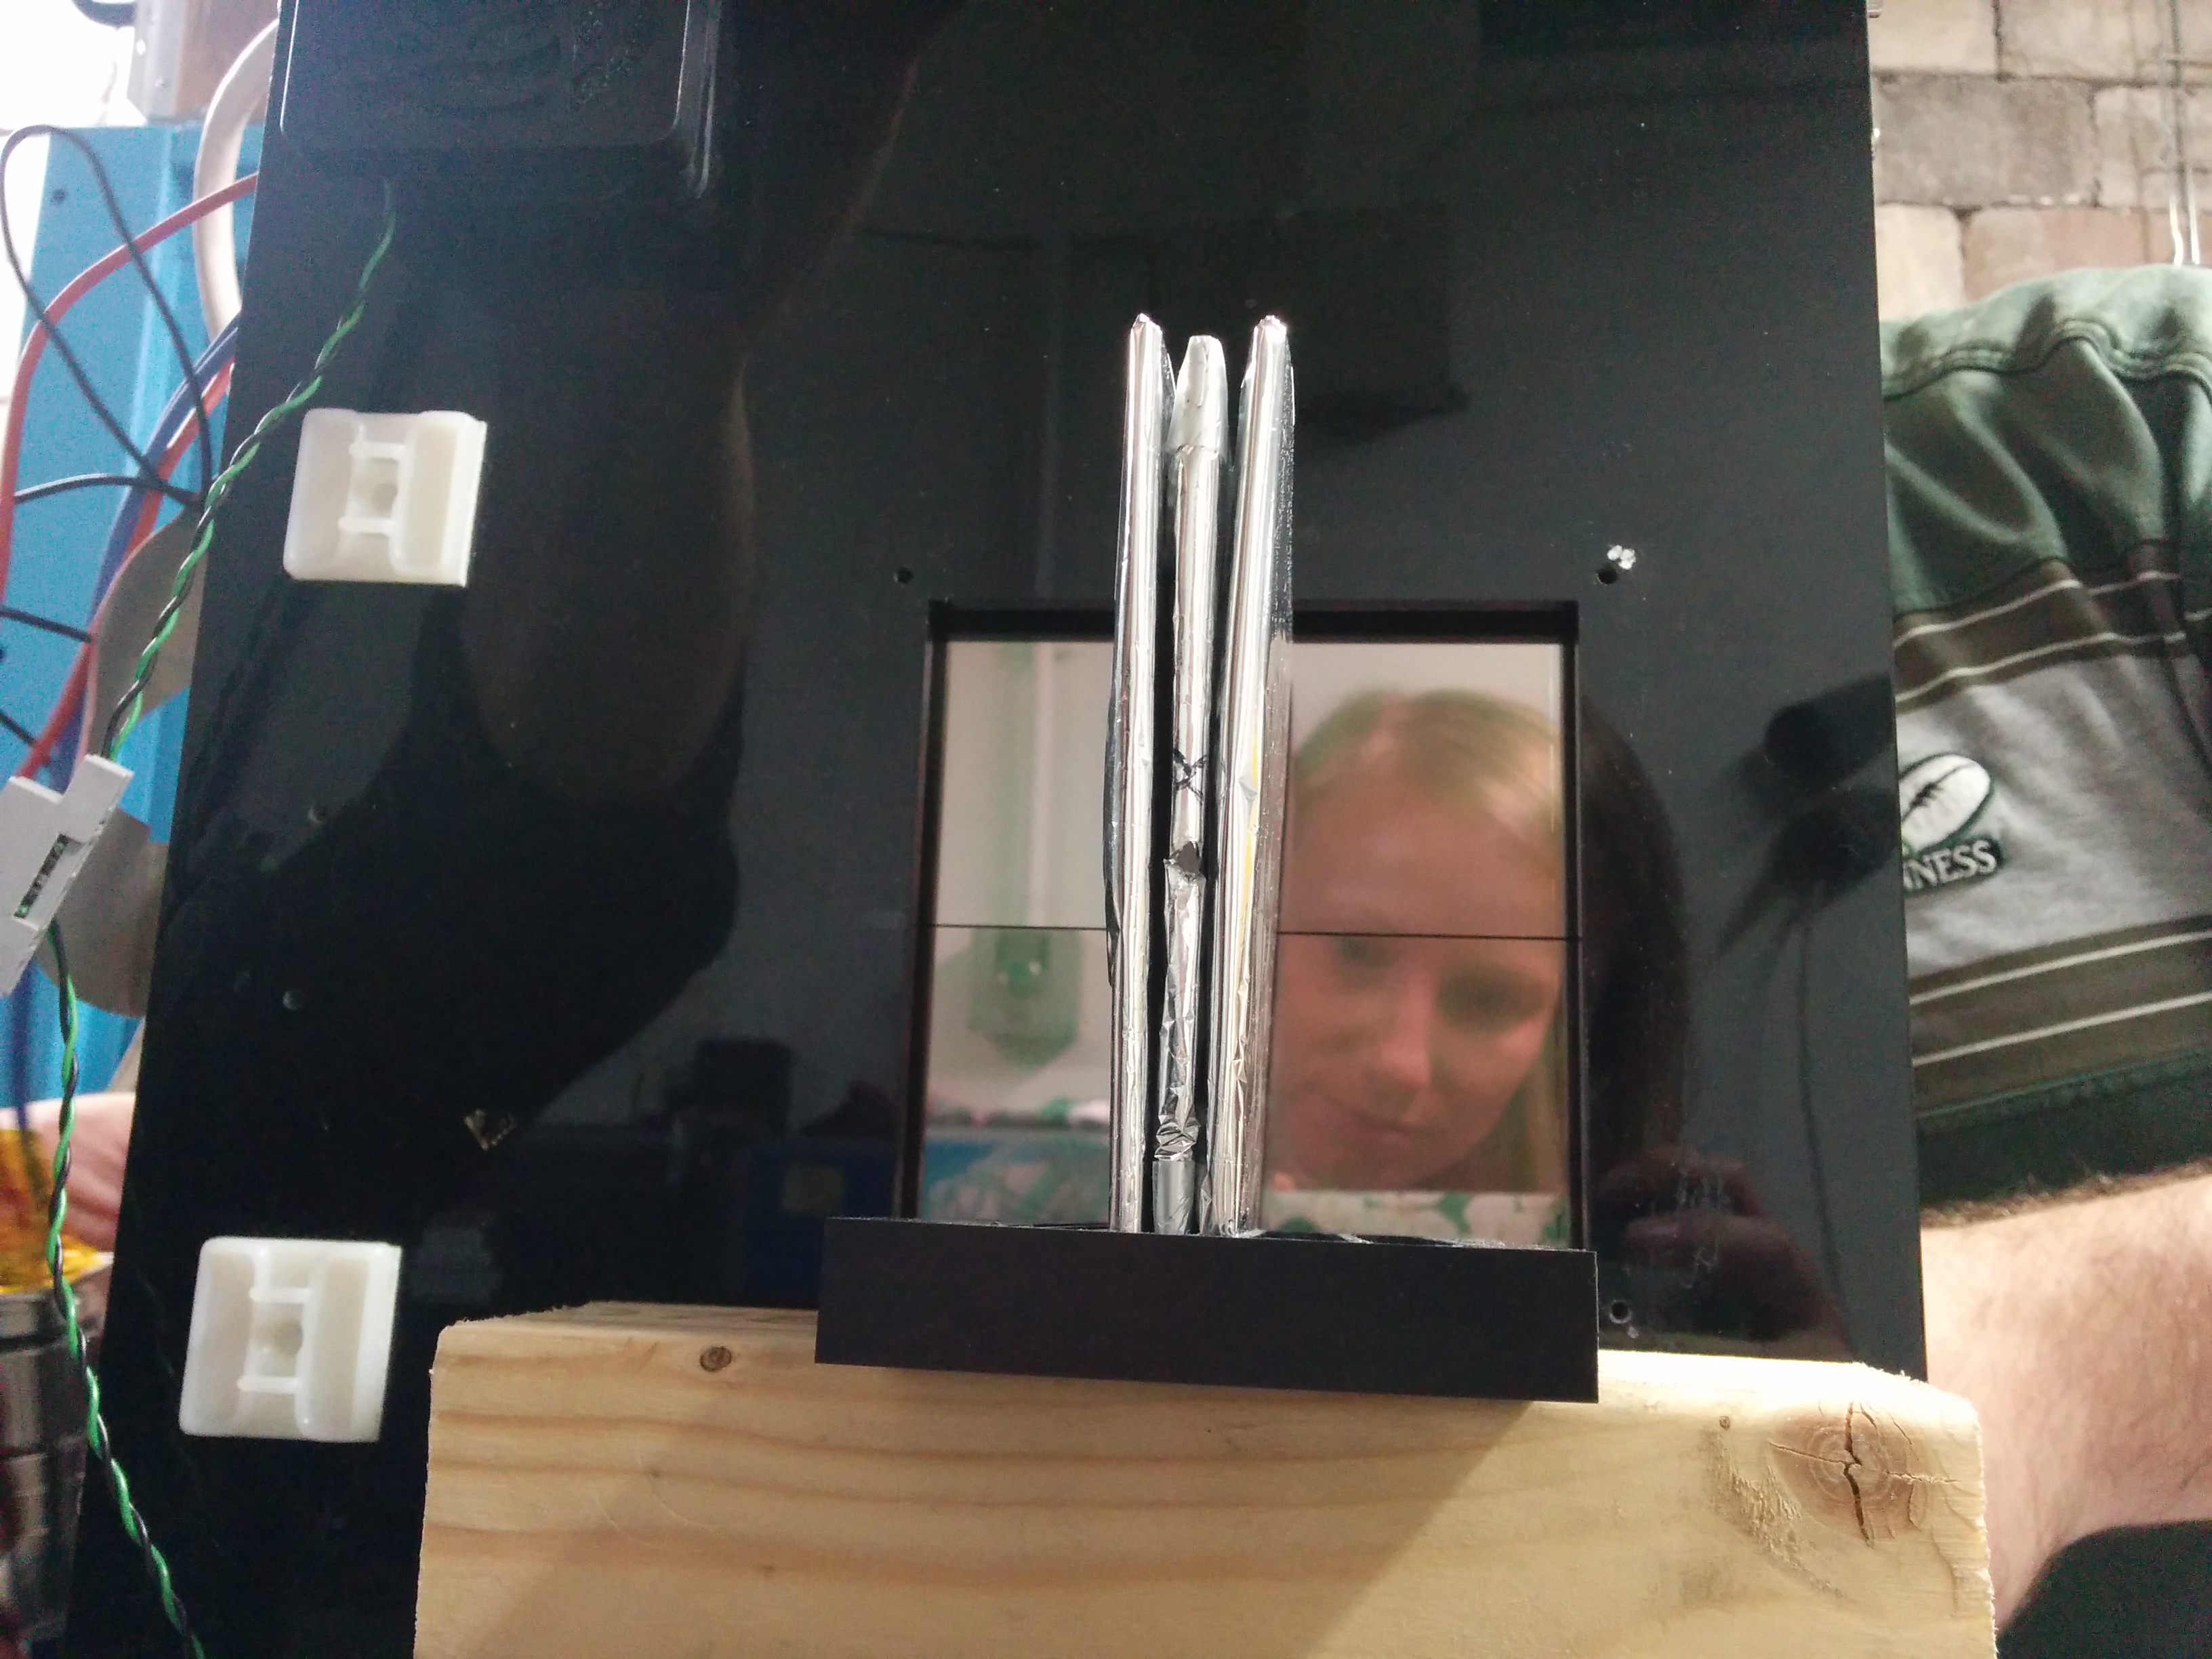
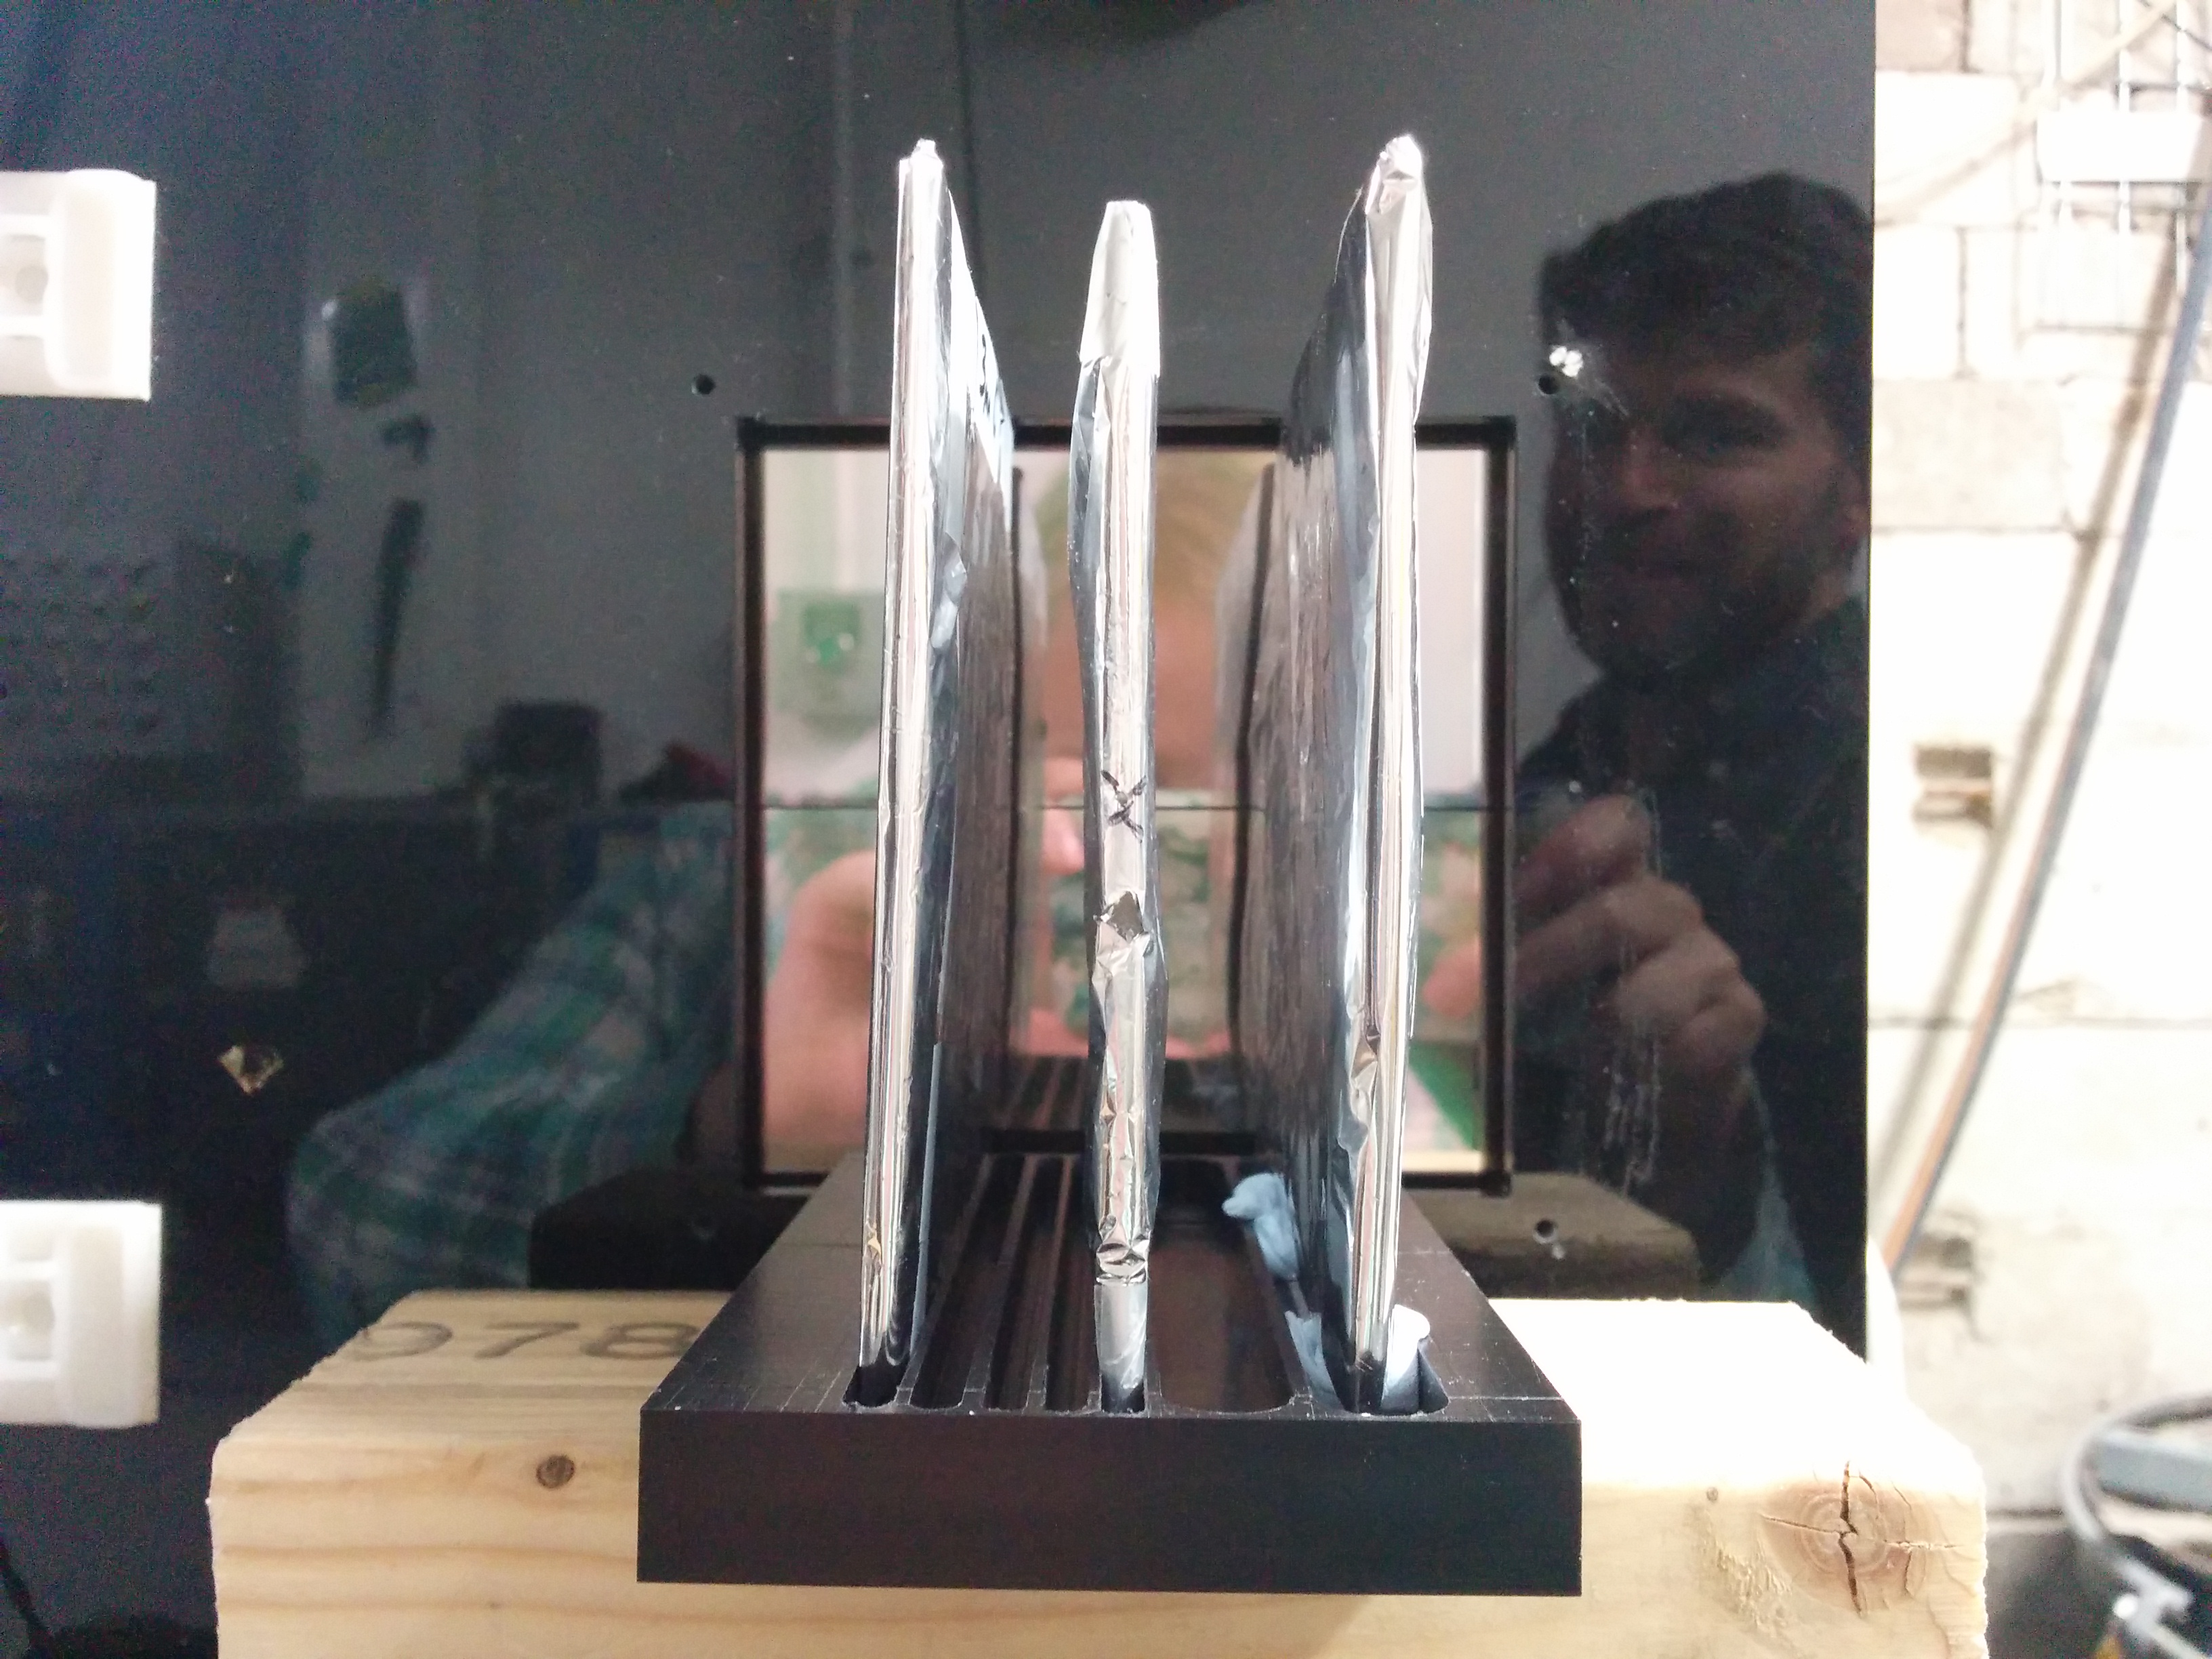
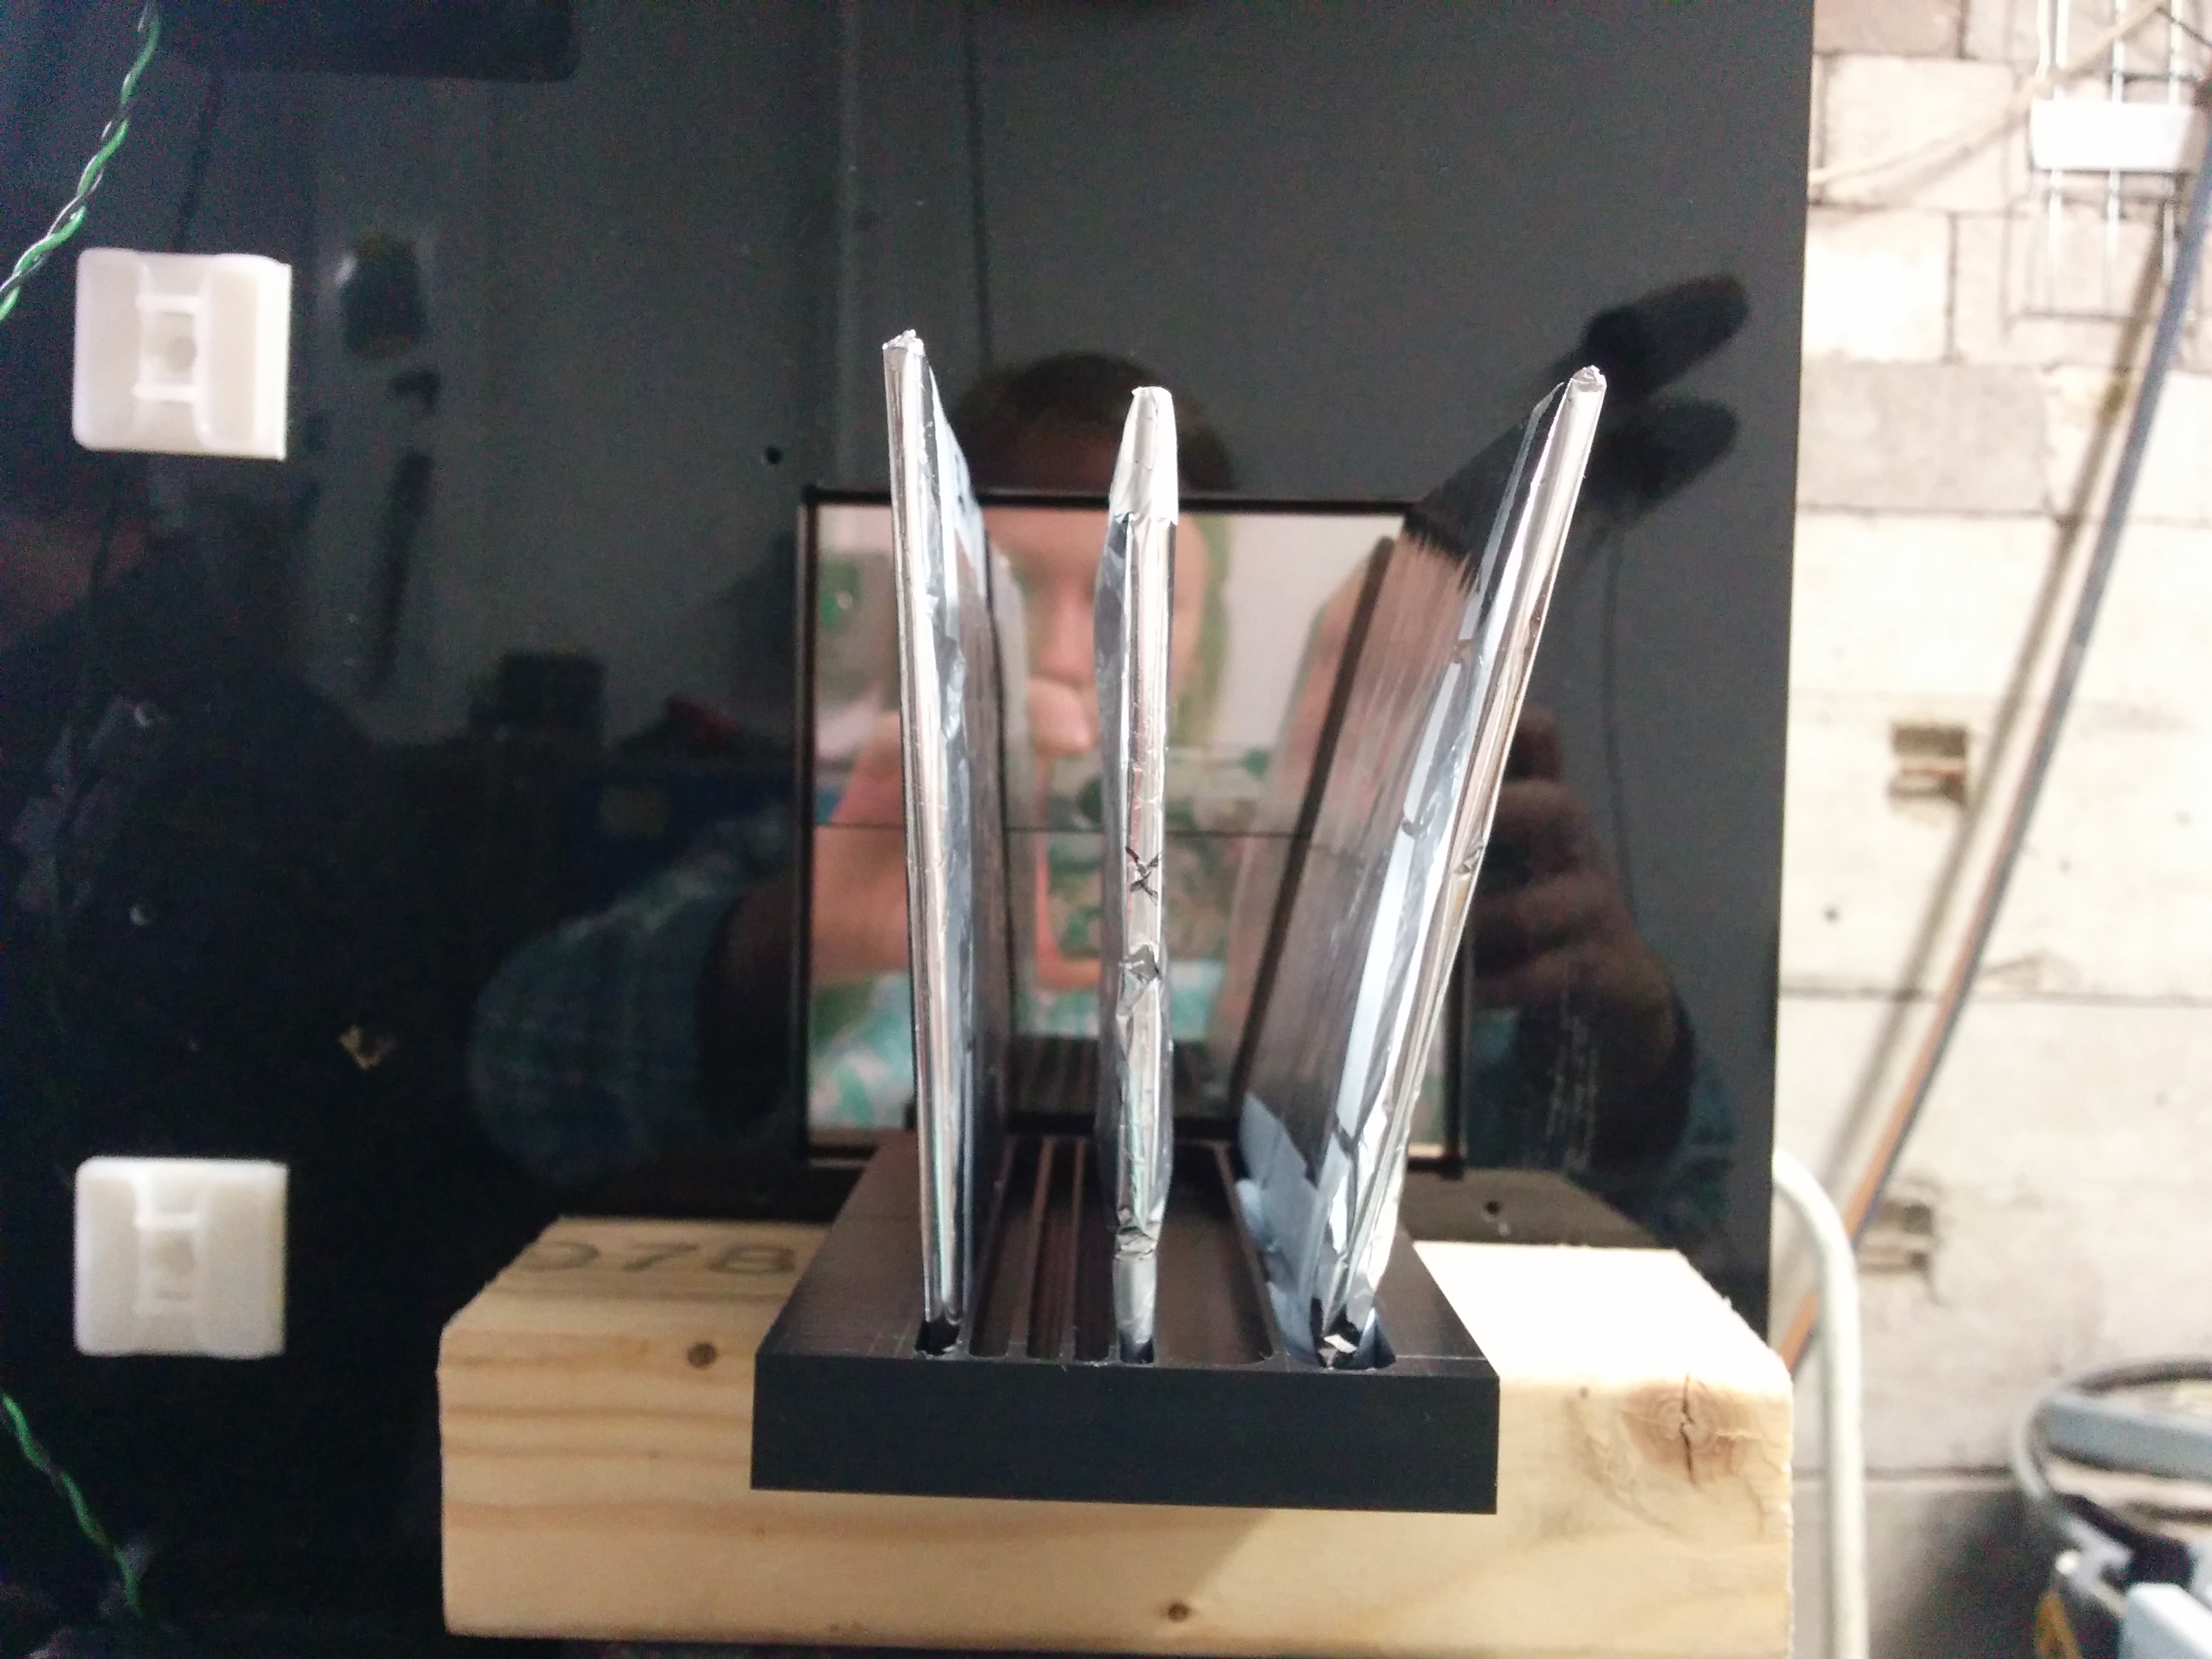
- The scintillator stack was set up perpendicular to the proton beam, with the exposed sides of the scintillator facing the sensors:
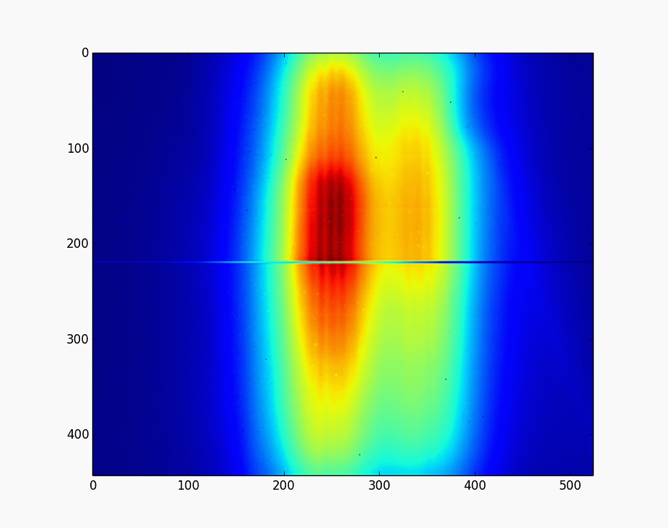
- The scintillator stack was quite well aligned with the horizontal centre of the beam. We did our best to align the vertical centre of the scintillator stack with the beam as well, however as can be seen from the image below, where the black "line" shows the divide between and hence the centre of the sensors, the beam hit just below centre:
- The working directory on the PRIAPUS computer where the data is stored is:
idMateData\Bham070917\
- The directory the data is stored at UCL in is:
/unix/pbt/data/birmingham/sept_2017
Data Taking
| Type of run | Current | Scintillator sheets used | Scintillator arrangement | Notes | File name |
|---|---|---|---|---|---|
| Background | N/A | 3 x 3 mm | ABC |
|
Background_1 |
| Beam | 1 nA | 3 x 3 mm | ABC | Saturation of sensor, ADC values at 14,000 | 28MeV_3mmscint_ABC_1nA_1cmC |
| Beam | 0.1 nA | 3 x 3 mm | ABC |
|
28MeV_3mmscint_ABC_100pA_1cmC_1 |
| Beam | 0.1 nA | 3 x 3 mm | ABC | Saturation of sensor | 28MeV_3mmscint_ABC_100pA_1cmC_2 |
| Beam | 10 pA | 3 x 3 mm | ABC | Sensor no longer saturated, but no separation due to formation of tiles | 28MeV_3mmscint_ABC_10pA_1cmC |
| Beam | 10 pA | 3 x 3 mm | ABC |
|
28MeV_3mmscint_ABC_spread_10pA_1cmC |
| Beam | 10 pA | 3 x 3 mm | ABC | Lights off this time! | 28MeV_3mmscint_ABC_spread_10pA_1cmC_2 |
| Beam | 10 pA | 3 x 3 mm | ABC | Repeat measurement for reproducibility | 28MeV_3mmscint_ABC_spread_10pA_1cmC_3 |
| Beam direction | N/A | N/A | N/A |
|
Laser_beam_direction |
| Beam direction | N/A | N/A | N/A |
SCREEN <--- BEAM
(where the arrow represents the direction of the beam)
|
Laser_beam_direction_cover |
| Beam | 10 pA | 4 mm and 3 mm | 3A 4A |
|
28MeV_3mmA_4mmA_spread_10pA_1cmC |
| Beam | 10 pA | 4 mm and 3 mm | 3A 4A | Lights off this time! | 28MeV_3mmA_4mmA_spread_10pA_1cmC_2 |
| Beam | 10 pA | 4 mm and 3 mm | 3A 4A | Repeat measurement for reproducibility | 28MeV_3mmA_4mmA_spread_10pA_1cmC_3 |
| Beam | 10 pA | 3 mm and 4 mm | 4A 3A |
|
28MeV_4mmA_3mmA_spread_10pA_1cmC |
| Beam | 20 pA | 3 mm and 4 mm | 4A 3A |
|
28MeV_4mmA_3mmA_spread_20pA_1cmC |
| Beam | 25 pA | 3 mm and 4 mm | 4A 3A |
|
28MeV_4mmA_3mmA_spread_25pA_1cmC |
| Beam | 20 pA | 3 x 3 mm | ABC |
|
28MeV_3mmscint_ABC_spread_20pA_1cmC |
| Beam | 20 pA | 3 x 3 mm | ABC |
|
28MeV_3mmscint_ABC_spread_20pA_1cmC_2 |
| Beam | 20 pA | 3 x 3 mm | BCA | Alignment: 3A [gap] 3C [gap] 3B <--- BEAM | 28MeV_3mmscint_BCA_spread_20mA_1cmC |
| Background | N/A | 3 x 3 mm | BCA | Background_2 | |
| Beam | 20 pA | 3 x 3 mm | BCA |
|
28MeV_3mmscint_BCA_spread_20mA_1cmC_2 |
| Beam | 20 pA | 3 x 3 mm | BCA | Lights off this time! | 28MeV_3mmscint_BCA_spread_20mA_1cmC_3 |
| Beam | 20 pA | 3 x 3 mm | CAB |
|
28MeV_3mmscint_CAB_spread_20pA_1cmC |
| Beam | 20 pA | 3 mm and 4 mm | 4A 3A | Alignment: 3A 4A <--- BEAM | 28MeV_4mmA_3mmA_spread_20pA_1cmC |
| Beam | 20 pA | 3 mm and 4 mm | 4B 3A | Alignment: 3A 4B <--- BEAM | 28MeV_4mmB_3mmA_spread_20pA_1cmC |
| Beam | 20 pA | 1 x 10 mm | 10 A |
|
28MeV_10mmA_20pA_1cmC |
| Background | N/A | 1 x 10 mm | 10A | Background_3 | |
| Beam | 20 pA | 1 x 10 mm | 10B | Alignment: 10B <--- BEAM | 28MeV_10mmB_20pA_1cmC |
| Beam | 10 pA | 1 x 10 mm | 10B | Decrease the current by a factor of 2 until we don't see anything above background | 28MeV_10mmB_10pA_1cmC |
| Beam | 5 pA | 1 x 10 mm | 10B | Current decreased by another factor of 2 | 28MeV_10mmB_5pA_1cmC |
| Beam | 2.5 pA | 1 x 10 mm | 10B | Current decreased by another factor of 2 | 28MeV_10mmB_2-5pA_1cmC |
| Beam | 1.25 pA | 1 x 10 mm | 10B | Current decreased by another factor of 2 | 28MeV_10mmB_1-25pA_1cmC |
| Beam | 20 pA | 1 x 10 mm | 10B |
|
28MeV_10mmB_20pA_1cmC_repeat |
| Beam | 20 pA | 1 x 10 mm | 10B |
|
28MeV_10mmB_20pA_1cmC_right |
| Beam | 20 pA | 1 x 10 mm | 10B |
|
28MeV_10mmB_20pA_1mcC_close |
| Beam | 10 pA | 1 x 10 mm | 10B |
|
28MeV_10mmB_10pA_1mcC_close |
| Beam | 7 pA | 1 x 10 mm | 10 B |
|
28MeV_10mmB_7pA_1cmC_close |
| Beam | 7 pA | 3 x 3 mm | ABC |
|
28MeV_3mmscint_ABC_7pA_1mcC_close |
| Beam | 5 pA | 3 x 3 mm | ABC | Current dropped to 5 pA in hope of seeing more separation with less light | 28MeV_3mmscint_ABC_4pA_1mcC_close |
Conclusions
- A very successful first test beam at Birmingham, where we could see the Bragg Peak when using two plates (3 mm and 4 mm):
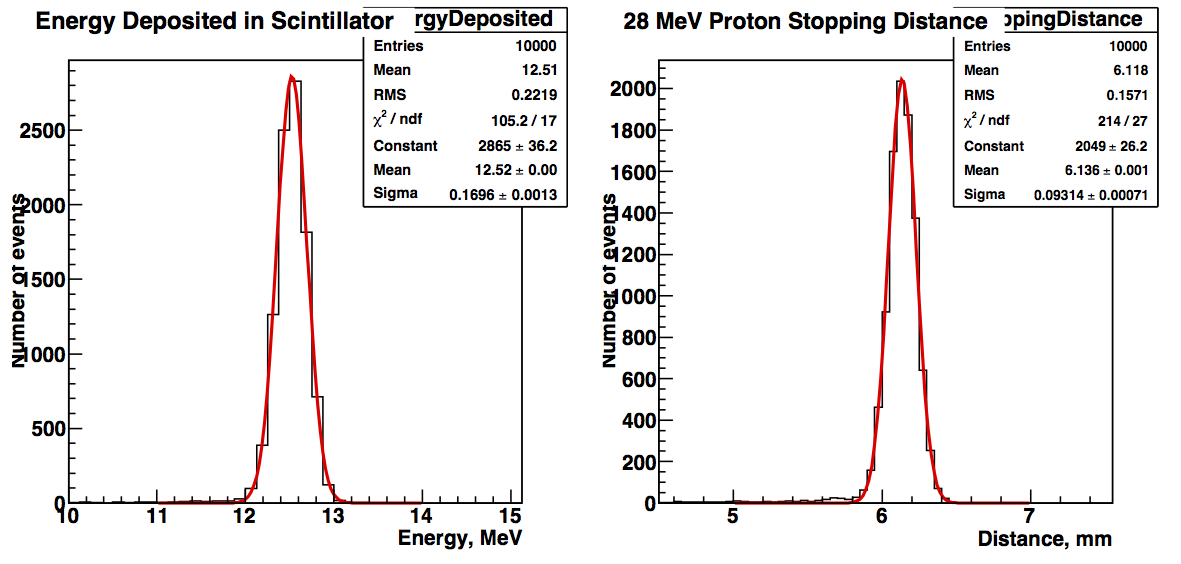
- Simulations were carried out of a 28 MeV proton energy and a 5 mm radius beam, with 10,000 events. The resulting energy deposited and the stopping distance can be seen below:
The stopping distance is ~ 6.1 mm, according to simulations. This agrees with the test beam where the Bragg peak is seen as two points in two plates totalling up to a total of 7 mm of scintillator.
- Full data analysis still to be carried out!
