Software/Geant4/Tutorials/PBTCVMFS/Proton Beam With Realistic Geometry
Proton Beam with Realistic Geometry
This example shows the dose distribution in water along the incident proton beam.
This example is very similar to the Monoenergetic Proton Pencil Beam example.
The difference is that the beam is defined with realistic geometry.
For the generation of the proton beam, instead of particle gun, we use general particle source.
For more details about G4GeneralParticleSource class look here.
The volume of the water cube is divided into slices perpendicular to the incident beam.
The slices are created using class G4PVReplica.
The energy and dose are scored using classes G4UserSteppingAction and G4UserRunAction.
Alternatively, the energy and the dose are scored using class G4ScoringManager by defining a scoring mesh.
There is an option to chose among several EM and the QGSP_BIC_EMY physics lists.
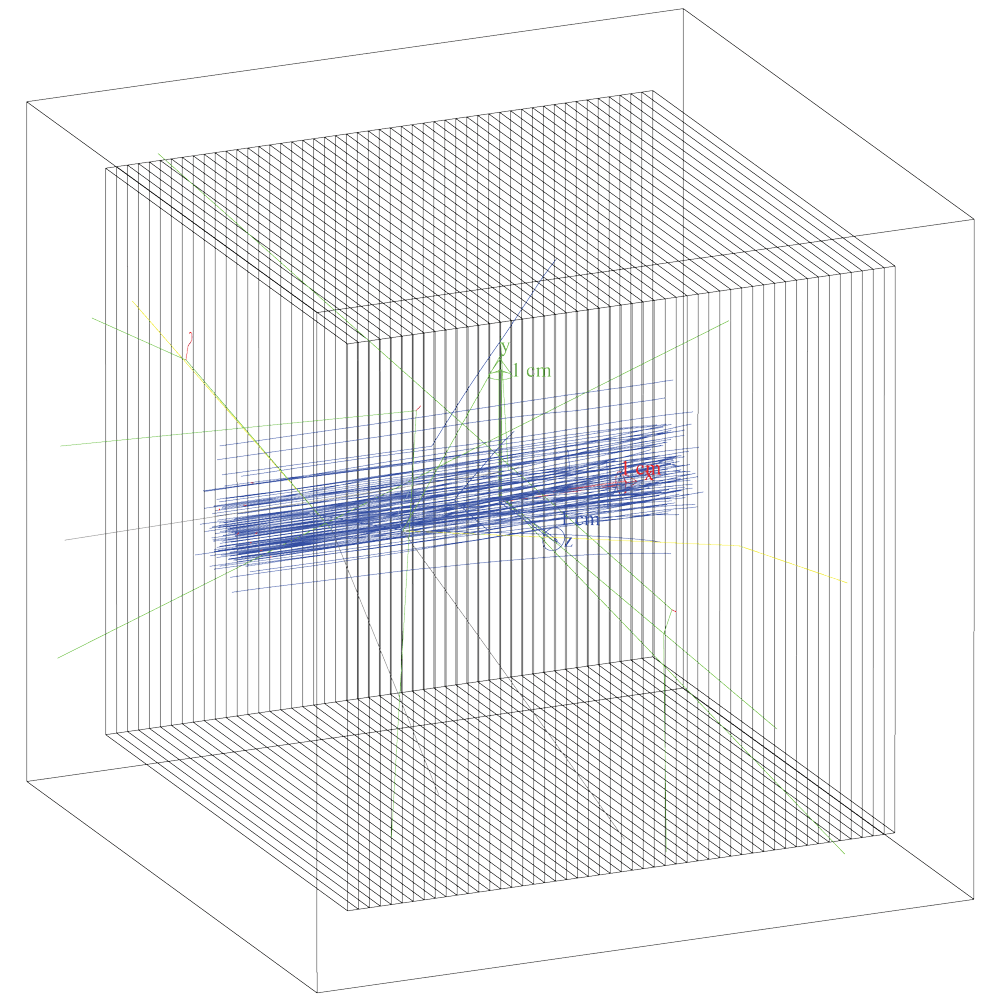
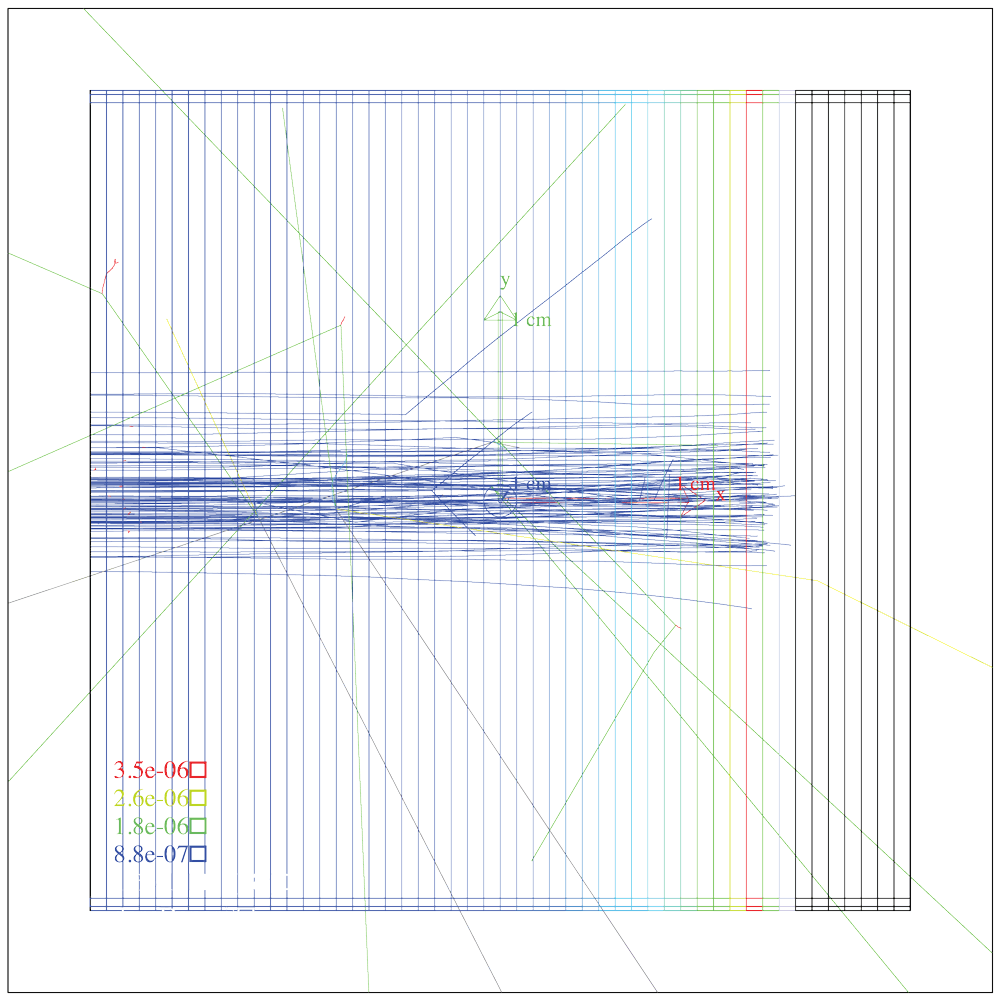
The image shows the water box divided into slices using class G4PVReplica.
Protons are in blue, photons are in green.
This tutorial is very similar to the Monoenergetic Proton Pencil Beam tutorial.
It is recommended to follow that tutorial first because some steps are similar.
Running the Tutorial
All the source files for the tutorial can be found in http://www.hep.ucl.ac.uk/pbt/wikiData/code/ProtonGB/.
The corresponding data files are available from http://www.hep.ucl.ac.uk/pbt/wikiData/data/ProtonGB/.
Create folder ProtonGBFolder
ssh -X username@plus1.hep.ucl.ac.uk

username@plus1.hep.ucl.ac.uk's password: type your password here

[username@plus1 ~]$ mkdir ProtonGBFolder

[username@plus1 ~]$ cd ProtonGBFolder
Setup Your Environment
[username@plus1 PhotonGBFolder]$ source /unix/pbt/software/scripts/pbt.sh
Copy the Code to Your Working Directory and Rename It
[username@plus1 PhotonGBFolder]$ cp -r /unix/pbt/tutorials/basic/ProtonGB .

[username@plus1 PhotonGBFolder]$ mv ProtonGB ProtonGB_source
Create the Build Directory
[username@plus1 PhotonGBFolder]$ mkdir ProtonGB_build
Compile the Code with Make and Cmake
[username@plus1 PhotonGBFolder]$ cd ProtonGB_build

[username@plus1 ProtonGB_build]$ cmake -DGeant4_DIR=/unix/pbt/software/dev /home/username/ProtonGBFolder/ProtonGB_source

[username@plus1 ProtonGB_build]$ make
Run Macro proton.mac
[username@plus1 ProtonGB_build]$ ./protonGB proton.mac
Analysing the Data
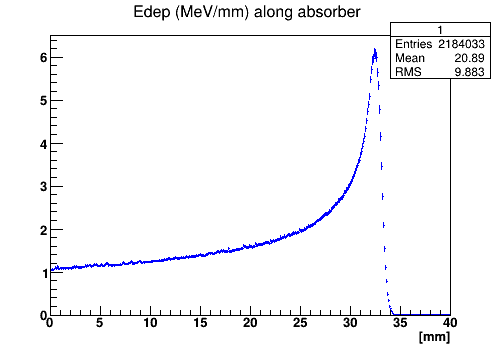
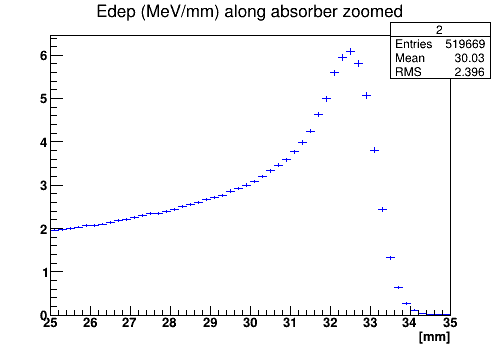
The macro produces a root file Proton.root with two histograms.
The first histogram shows the energy deposition in water box along the beam line, the second histogram shows zoomed energy deposition around the peak.
The macro also produces several text files.
- The data in files
DoseFile.txtandPlotDose.txtwas created using classesG4UserSteppingActionandG4UserRunAction. The fileDoseFile.txtcontains energy and dose deposition for every layer. The filePlotDose.txtcontains only depth vs dose for each layer. These text files can be analyzed with MATLAB or ROOT.
- The files
DoseLongitudinalMesh.txt,EnergyLongitudinalMesh.txt,DoseLateralMesh.txtandEnergyLateralMesh.txtcontain information about the dose and energy deposition in voxels in longitudinal and lateral direction of the beam. The data was created using classG4ScoringManagerand commands/score/inproton.mac. These text files can be analyzed with MATLAB or ROOT.
- The two ways to record data should give similar result.
Text files
This is an example output for DoseFile.txt with physics process QGSP_BIC_EMY and incident proton energy of 62 MeV.
Use your favorite editor pico, vi, emacs etc. to open text files.
Now, open the text file DoseFile.txt:
[username@plus1 ProtonGB_build]$ pico DoseFile.txt
DoseFile.txt
 Layers 	 x[mm]    Edep      Edep/Ebeam[%]  Dose 	Dose/MaxDose[%]
 layer 1: 	0.8	5.20624 GeV	1.399	6.517e-07 Gy	18.49
 layer 2: 	1.6	5.255 GeV	1.413	6.578e-07 Gy	18.67
 layer 3: 	2.4	5.349 GeV	1.438	6.696e-07 Gy	19
 layer 4: 	3.2	5.464 GeV	1.469	6.839e-07 Gy	19.41
 layer 5: 	4	5.533 GeV	1.487	6.926e-07 Gy	19.66
 layer 6: 	4.8	5.546 GeV	1.491	6.942e-07 Gy	19.7
 layer 7: 	5.6	5.592 GeV	1.503	7e-07 Gy	19.87
 layer 8: 	6.4	5.586 GeV	1.502	6.993e-07 Gy	19.84
 layer 9: 	7.2	5.748 GeV	1.545	7.194e-07 Gy	20.42
 layer 10: 	8	5.827 GeV	1.566	7.293e-07 Gy	20.7
 layer 11: 	8.8	5.922 GeV	1.592	7.412e-07 Gy	21.04
 layer 12: 	9.6	5.949 GeV	1.599	7.446e-07 Gy	21.13
 layer 13: 	10.4	6.05 GeV	1.626	7.573e-07 Gy	21.49
 layer 14: 	11.2	6.195 GeV	1.665	7.755e-07 Gy	22.01
 layer 15: 	12	6.306 GeV	1.695	7.894e-07 Gy	22.4
 layer 16: 	12.8	6.365 GeV	1.711	7.967e-07 Gy	22.61
 layer 17: 	13.6	6.499 GeV	1.747	8.135e-07 Gy	23.09
 layer 18: 	14.4	6.634 GeV	1.783	8.303e-07 Gy	23.56
 layer 19: 	15.2	6.731 GeV	1.809	8.425e-07 Gy	23.91
 layer 20: 	16	6.915 GeV	1.859	8.655e-07 Gy	24.56
 layer 21: 	16.8	7.099 GeV	1.908	8.886e-07 Gy	25.22
 layer 22: 	17.6	7.168 GeV	1.927	8.972e-07 Gy	25.46
 layer 23: 	18.4	7.301 GeV	1.963	9.138e-07 Gy	25.93
 layer 24: 	19.2	7.593 GeV	2.041	9.505e-07 Gy	26.97
 layer 25: 	20	7.718 GeV	2.075	9.66e-07 Gy	27.42
 layer 26: 	20.8	7.952 GeV	2.138	9.954e-07 Gy	28.25
 layer 27: 	21.6	8.149 GeV	2.191	1.02e-06 Gy	28.95
 layer 28: 	22.4	8.446 GeV	2.27	1.057e-06 Gy	30
 layer 29: 	23.2	8.784 GeV	2.361	1.1e-06 Gy	31.2
 layer 30: 	24	9.082 GeV	2.441	1.137e-06 Gy	32.26
 layer 31: 	24.8	9.47 GeV	2.546	1.185e-06 Gy	33.64
 layer 32: 	25.6	9.929 GeV	2.669	1.243e-06 Gy	35.27
 layer 33: 	26.4	10.54 GeV	2.833	1.319e-06 Gy	37.44
 layer 34: 	27.2	11.25 GeV	3.023	1.408e-06 Gy	39.95
 layer 35: 	28	12.11 GeV	3.256	1.516e-06 Gy	43.03
 layer 36: 	28.8	13.21 GeV	3.55	1.653e-06 Gy	46.91
 layer 37: 	29.6	14.65 GeV	3.938	1.834e-06 Gy	52.05
 layer 38: 	30.4	16.98 GeV	4.564	2.125e-06 Gy	60.31
 layer 39: 	31.2	21.42 GeV	5.759	2.682e-06 Gy	76.1
 layer 40: 	32	28.15 GeV	7.567	3.524e-06 Gy	100
 layer 41: 	32.8	15.14 GeV	4.07	1.895e-06 Gy	53.78
 layer 42: 	33.6	1.256 GeV	0.3376	1.572e-07 Gy	4.462
 layer 43: 	34.4	18.93 MeV	0.005087   2.369e-09 Gy	0.06723
 layer 44: 	35.2	597.5 keV	0.0001606  7.479e-11 Gy	0.002122
 layer 45: 	36	665.8 keV	0.000179   8.334e-11 Gy	0.002365
 layer 46: 	36.8	130.1 keV	3.498e-05  1.629e-11 Gy	0.0004623
 layer 47: 	37.6	457.2 keV	0.0001229  5.722e-11 Gy	0.001624
 layer 48: 	38.4	247.8 keV	6.661e-05  3.102e-11 Gy	0.0008802
 layer 49: 	39.2	236.6 keV	6.361e-05  2.962e-11 Gy	0.0008406
 layer 50: 	40	0 eV 	0	0 Gy	0


 The run consists of 6000  protons of 62 MeV through 4 cm  of Water (density: 1 g/cm3 ) divided
 into 50 slices.

 Edep is the deposited energy in every slice.
 Total incident energy(Ebeam)= 372 GeV
 Total energy deposit= 367.3 GeV
 Dose is the deposited dose in every slice.
 MaxDose is the highest dose value from all slices.
PlotDose.txt
The corresponding PlotDose.txt is:
0.8	18.4941
1.6	18.668
2.4	19.0022
3.2	19.4096
4	19.6559
4.8	19.7012
5.6	19.8661
6.4	19.8446
7.2	20.4168
8	20.6987
8.8	21.0351
9.6	21.1327
10.4	21.493
11.2	22.0079
12	22.4025
12.8	22.6104
13.6	23.0872
14.4	23.5642
15.2	23.9102
16	24.564
16.8	25.2168
17.6	25.4611
18.4	25.9348
19.2	26.9738
20	27.4152
20.8	28.2496
21.6	28.9492
22.4	30.0033
23.2	31.2049
24	32.2636
24.8	33.6414
25.6	35.2707
26.4	37.4412
27.2	39.9539
28	43.0264
28.8	46.9139
29.6	52.0461
30.4	60.3067
31.2	76.1028
32	100
32.8	53.7805
33.6	4.46152
34.4	0.0672278
35.2	0.00212242
36	0.00236509
36.8	0.000462313
37.6	0.00162397
38.4	0.00088024
39.2	0.000840567
40	0
The files DoseLongitudinalMesh.txt and EnergyLongitudinalMesh.txt contain information about the dose and energy deposition in 50 voxels along the beam.
DoseLongitudinalMesh.txt
# mesh name: waterMeshlongitudinal
# primitive scorer name: doseDeposit
# iX, iY, iZ, value [Gy]
0,0,0,6.469868647737213e-07
1,0,0,6.516649564153393e-07
2,0,0,6.577926819277117e-07
3,0,0,6.695690202969499e-07
4,0,0,6.839237862965744e-07
5,0,0,6.92602453198006e-07
6,0,0,6.941983340913045e-07
7,0,0,7.000117067455529e-07
8,0,0,6.992541852270209e-07
9,0,0,7.194158865234905e-07
10,0,0,7.293495837756137e-07
11,0,0,7.41201700936238e-07
12,0,0,7.446419124464421e-07
13,0,0,7.573357796857087e-07
14,0,0,7.754785220925501e-07
15,0,0,7.893834566998274e-07
16,0,0,7.967100253214534e-07
17,0,0,8.135099998792694e-07
18,0,0,8.303180031825529e-07
19,0,0,8.425101623571658e-07
20,0,0,8.655459861014581e-07
21,0,0,8.885506679193925e-07
22,0,0,8.971586167670115e-07
23,0,0,9.138482403868449e-07
24,0,0,9.5045982833084e-07
25,0,0,9.660128430654312e-07
26,0,0,9.954142868133062e-07
27,0,0,1.020067080811169e-06
28,0,0,1.057207995025754e-06
29,0,0,1.099550560246554e-06
30,0,0,1.136855274403775e-06
31,0,0,1.185403027422606e-06
32,0,0,1.242815187517349e-06
33,0,0,1.319293455278404e-06
34,0,0,1.407832250152724e-06
35,0,0,1.51609499591034e-06
36,0,0,1.653076518568283e-06
37,0,0,1.833917486405657e-06
38,0,0,2.124993870952412e-06
39,0,0,2.681589038746766e-06
40,0,0,3.523642708161995e-06
41,0,0,1.89503347132408e-06
42,0,0,1.572080835161135e-07
43,0,0,2.368868657843645e-09
44,0,0,7.478650628820136e-11
45,0,0,8.333744859360306e-11
46,0,0,1.629027142431914e-11
47,0,0,5.722304567861716e-11
48,0,0,3.10165028906845e-11
49,0,0,2.961859128277559e-11
EnergyLongitudinalMesh.txt
# mesh name: waterMeshlongitudinal
# primitive scorer name: energyDeposit
# iX, iY, iZ, value [MeV]
0,0,0,5168.863690298075
1,0,0,5206.237583560506
2,0,0,5255.192793672967
3,0,0,5349.27551948336
4,0,0,5463.957644883483
5,0,0,5533.292663365925
6,0,0,5546.042367034644
7,0,0,5592.486170559489
8,0,0,5586.434230891212
9,0,0,5747.508730915954
10,0,0,5826.870352971223
11,0,0,5921.558485575125
12,0,0,5949.042790636348
13,0,0,6050.455776022791
14,0,0,6195.400546272422
15,0,0,6306.488909144618
16,0,0,6365.021835521787
17,0,0,6499.23905571252
18,0,0,6633.520418613331
19,0,0,6730.925191871036
20,0,0,6914.961436516608
21,0,0,7098.748884190934
22,0,0,7167.518926782089
23,0,0,7300.854538724519
24,0,0,7593.349360290987
25,0,0,7717.604453420952
26,0,0,7952.496478754212
27,0,0,8149.450912758888
28,0,0,8446.174591956587
29,0,0,8784.454949472683
30,0,0,9082.487248090749
31,0,0,9470.341672171433
32,0,0,9929.015017570997
33,0,0,10540.01002048382
34,0,0,11247.35817069493
35,0,0,12112.28357494451
36,0,0,13206.64708873234
37,0,0,14651.40951478239
38,0,0,16976.85727439521
39,0,0,21423.5697343364
40,0,0,28150.84794367824
41,0,0,15139.67320689325
42,0,0,1255.956185435052
43,0,0,18.92520522328615
44,0,0,0.597479296604468
45,0,0,0.6657939063851204
46,0,0,0.1301451343988455
47,0,0,0.4571624853000977
48,0,0,0.2477949465755464
49,0,0,0.2366268457287175
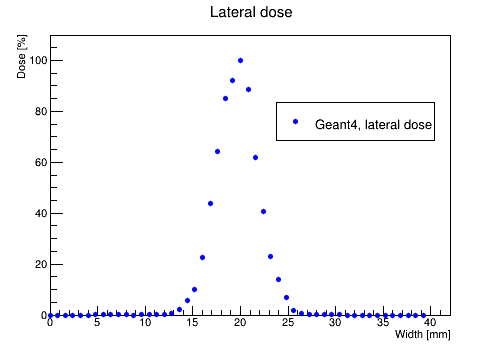
The files DoseLateralMesh.txt and EnergyLateralMesh.txt contain information about the dose and energy deposition in 50 voxels in direction perpendicular to the beam at its peak location along the beam.
DoseLateralMesh.txt
# mesh name: waterMeshlateral
# primitive scorer name: doseDeposit
# iX, iY, iZ, value [Gy]
0,0,0,0
0,0,1,0
0,0,2,0
0,0,3,0
0,0,4,0
0,0,5,0
0,0,6,1.466246250154914e-10
0,0,7,9.078823200018241e-10
0,0,8,3.835234226137076e-10
0,0,9,3.994423499964391e-10
0,0,10,9.960764667025115e-09
0,0,11,0
0,0,12,3.334497598196315e-08
0,0,13,4.047608579035546e-08
0,0,14,1.633393015757941e-08
0,0,15,8.173977021363016e-08
0,0,16,9.228243760268087e-08
0,0,17,4.662559928378806e-07
0,0,18,1.270053275754999e-06
0,0,19,2.230986415655344e-06
0,0,20,5.104329096974313e-06
0,0,21,9.963169606475199e-06
0,0,22,1.451696954994929e-05
0,0,23,1.924572153782845e-05
0,0,24,2.091337992430692e-05
0,0,25,2.26568273285739e-05
0,0,26,2.004692506326543e-05
0,0,27,1.406336479390524e-05
0,0,28,9.256051808211996e-06
0,0,29,5.220414178091977e-06
0,0,30,3.156776573370929e-06
0,0,31,1.51967128709898e-06
0,0,32,4.101989539700862e-07
0,0,33,1.484317846085204e-07
0,0,34,6.387660069678889e-08
0,0,35,3.943666861849931e-08
0,0,36,3.847137480029435e-08
0,0,37,2.453995738107862e-08
0,0,38,1.016185920365891e-08
0,0,39,0
0,0,40,0
0,0,41,0
0,0,42,0
0,0,43,0
0,0,44,0
0,0,45,0
0,0,46,0
0,0,47,0
0,0,48,0
0,0,49,0
EnergyLateralMesh.txt
# mesh name: waterMeshlateral
# primitive scorer name: energyDeposit
# iX, iY, iZ, value [MeV]
0,0,0,0
0,0,1,0
0,0,2,0
0,0,3,0
0,0,4,0
0,0,5,0
0,0,6,0.0585701767385346
0,0,7,0.3626596005594529
0,0,8,0.1532009690969662
0,0,9,0.1595598899821584
0,0,10,3.97889336076374
0,0,11,0
0,0,12,13.31987131356298
0,0,13,16.16844031604335
0,0,14,6.524696489851074
0,0,15,32.65149211787384
0,0,16,36.86283037164294
0,0,17,186.2490417488218
0,0,18,507.3311854708301
0,0,19,891.1822870980759
0,0,20,2038.958035253929
0,0,21,3979.85402974156
0,0,22,5798.899551549559
0,0,23,7687.830825225591
0,0,24,8353.988003293192
0,0,25,9050.419606043853
0,0,26,8007.876875358159
0,0,27,5617.704130056525
0,0,28,3697.391145932902
0,0,29,2085.328989089619
0,0,30,1260.995291935896
0,0,31,607.042751928332
0,0,32,163.8566866203518
0,0,33,59.29205859669631
0,0,34,25.51593084635307
0,0,35,15.75323824848989
0,0,36,15.36764524505744
0,0,37,9.802648366971269
0,0,38,4.059221904148255
0,0,39,0
0,0,40,0
0,0,41,0
0,0,42,0
0,0,43,0
0,0,44,0
0,0,45,0
0,0,46,0
0,0,47,0
0,0,48,0
0,0,49,0
Root file
Open the Proton.root file in the following way:
[username@plus1 ProtonGB_build]$ root -l Proton.root

root [1] new TBrowser

Select ROOT Files and Proton.root
The energy deposition along the beam in the absorber
The energy deposition along the beam zoomed around the peak
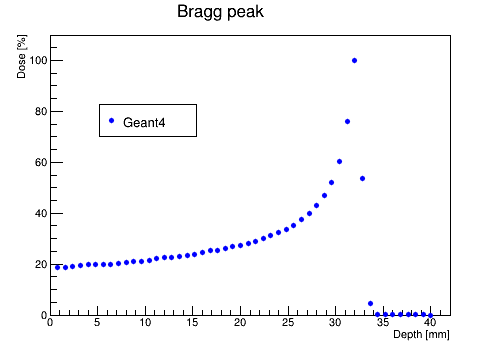
Plotting the dose distribution
You can use script PlotSimulation.C from folder RootScripts to plot the dose deposition along the absorber.
This script uses PlotDose.txt.
Copy the script from /ProtonGB_source/RootScripts/ to your build directory as it was done in the Monoenergetic Proton Pencil Beam tutorial and run it:
[username@plus1 ProtonGB_build]$ root -l

root [1] .x PlotSimulation.C
This will create root file with the following plot:
You can also plot the file PlotDose.txt using MATLAB.
Similarly to the previous example first copy the text file to your computer.
In the terminal at your computer write:
scp username@plus1.hep.ucl.ac.uk:/home/username/ProtonGBFolder/ProtonGB_build/PlotDose.txt .
Then, open MATLAB and follow the procedure:
- Import the file: Chose 'HOME' tab and 'Import Data'.
- In the 'Import Data' window select the 'PlotDose.txt' file choosing the right path.
- In the opened window select the data points in the 'IMPORT' tab. If you like, you can change the name of the variables. For example, 'x' instead of 'VarName1' and 'Dose' instead of 'VarName2'. Then, press 'Import Selection'/'Import Data'.
- Close the Import Window and in the Command Window type plot(x,Dose). Press Enter.
This plot will be created with added axis labels and a legend:
File:ProtonGB matlab2protonreal.png
Similarly to the previous tutorial you can plot the data in DoseLongitudinalMesh.txt and DoseLateralMesh.txt
which were created using commands /score/ in the macro proton.mac.
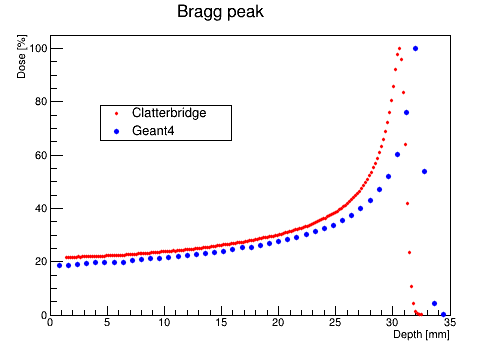
The file DoseLongitudinalMesh.txt will be used later to compare with data from the Clatterbridge Cancer Center.
Now, use script PlotLateralDoseMesh.C to plot the lateral dose distribution.
[username@plus1 ProtonGB_build]$ cp /home/username/ProtonGBFolder/ProtonGB_source/RootScripts/PlotLateralDoseMesh.C .

[username@plus1 ProtonGB_build]$ root -l

root [1] .x PlotLateralDoseMesh.C
This will create LateralDose_Mesh.root file with the following plot:
Run with different settings
You can change the physics process, incident proton energy and number of slices by modifying the macro proton.mac.
In addition, you can configure the particle source by using /gps/ commands.
The beam characteristics used in this macro are similar to the ones used at the Laboratori Nazionali del Sud (INFN) in Catania, Italy and the Clatterbridge Cancer Center(energy distribution is similar).
The proton beam has Guassian energy distribution.
Here you can learn more about the different /gps/ commands.
Open the macro proton.mac:
[username@plus1 ProtonGB_build]$ pico proton.mac
You will see:
# proton.mac
#
/control/verbose 2
/run/verbose 2
/tracking/verbose 0
/run/particle/verbose 1
/run/particle/dumpList
#
# set geometry
/protonGB/det/setSizeX  4 cm
/protonGB/det/setSizeYZ 4 cm
/protonGB/det/setSliceSizeYZ 4 cm
/protonGB/det/sliceNumber 50
#
# define longitudinal scoring mesh
# along the beam
/score/create/boxMesh waterMeshlongitudinal
/score/mesh/boxSize 2. 2. 2. cm
/score/mesh/nBin 50 1 1
/score/mesh/translate/xyz 0. 0. 0. cm
/score/quantity/energyDeposit energyDeposit
/score/quantity/doseDeposit doseDeposit
/score/close
#
# define lateral scoring mesh
# centered at the Bragg peak
/score/create/boxMesh waterMeshlateral
/score/mesh/boxSize 0.1 2. 2. cm
/score/mesh/nBin 1 1 50
/score/mesh/translate/xyz 1.2 0. 0. cm
/score/quantity/energyDeposit energyDeposit
/score/quantity/doseDeposit doseDeposit
/score/close
#
# set physics process
/protonGB/phys/addPhysics QGSP_BIC_EMY
#/protonGB/phys/addPhysics emlivermore
#/protonGB/phys/addPhysics empenelope
#
# production tresholds (recommended range
#cut off not bigger than 10% of slice thickness)
/protonGB/phys/setCuts 0.2 mm
#/protonGB/phys/setGCut 1 um
#/protonGB/phys/setECut 1 um
#/protonGB/phys/setPCut 1 um
#
# initialize
/run/initialize
#
# visualisation
#/control/execute visualisation.mac
#
# General particle source
# proton circle source
/gps/pos/shape Circle
/gps/pos/centre -2. 0. 0. cm
/gps/pos/radius 0. mm
/gps/pos/sigma_r 2. mm
/gps/particle proton
/gps/pos/type Beam
#
# the incident surface is in the y-z plane
/gps/pos/rot1 0 1 0
/gps/pos/rot2 0 0 1
#
# the beam is travelling along the x-axis without any angular
#dispersion (angular despersion set to 0.0)
/gps/ang/rot1 0 0 1
/gps/ang/rot2 0 1 0
/gps/ang/type beam1d
/gps/ang/sigma_r 0. deg
#
# the beam energy is in gaussian profile
/gps/ene/type Gauss
/gps/ene/mono 62 MeV
/gps/ene/sigma 0.3 MeV
#
# step limit (recommended not bigger than 5% of
# slice thickness)
/protonGB/stepMax 0.1 mm
#
/protonGB/event/printModulo 50
#
# output file
/analysis/setFileName Proton
#
/analysis/h1/set 2 50 25 35 mm
# number of events
/run/beamOn 6000
#
# drawing projections
#/score/drawProjection waterMeshlongitudinal doseDeposit
#/score/drawProjection waterMeshlateral doseDeposit

# dump scores to a file
/score/dumpQuantityToFile waterMeshlongitudinal doseDeposit DoseLongitudinalMesh.txt
/score/dumpQuantityToFile waterMeshlongitudinal energyDeposit EnergyLongitudinalMesh.txt
/score/dumpQuantityToFile waterMeshlateral doseDeposit DoseLateralMesh.txt
/score/dumpQuantityToFile waterMeshlateral energyDeposit EnergyLateralMesh.txt
You can modify proton.mac as it is done in the tutorial Monoenergetic Proton Pencil Beam.
In addition to that you can modify the beam characteristics via commands /score/ and visualise their effect.
How to run visualisation is explained in the next section.
Visualisation
In macro proton.mac uncomment the line /control/execute visualisation.mac.
This will run macro visualisation.mac with a specific visualisation setup.
The lines /score/drawProjection waterMeshlongitudinal doseDeposit and /score/drawProjection waterMeshlateral doseDeposit you will draw the dose projections in longitudinal and lateral directions.
To run the visualisation, first uncomment lines /control/execute visualisation.mac and /score/drawProjection waterMeshlongitudinal doseDeposit.
Then, run the proton.mac
[username@plus1 ProtonGB_build]$ ./protonGB proton.mac
In addition to the text files the code will create two .prim files, g4_00.prim and g4_01.prim.
The first file, g4_00.prim, contains detector geometry and particle interactions:
The second file, g4_01.prim contains dose projections in longitudinal direction:
Now, in proton.mac macro uncomment /score/drawProjection waterMeshlateral doseDeposit and comment /score/drawProjection waterMeshlongitudinal doseDeposit.
Run proton.mac with the new settings.
The image with the lateral dose projections will look like that:
Comparison with data from The Clatterbridge Cancer Centre
Compare simulation with data using ROOT macros in folder RootScripts.
These scripts are similar to the ones used in the tutorial Monoenergetic Proton Pencil Beam.
For example, by using PlotDataAndSim.C you can compare proton data from Clatterbridge with simulation (PlotDose.txt).
Files
List of files for Proton Beam With Realistic Geometry simulation.
