Clatterbridge/TOPAS
This simulation is a model of the 62.5 MeV ocular proton therapy beamline at the Clatterbridge Cancer Centre built using TOPAS, a wrap around of the Geant4 code specifically developed for proton therapy applications. This model was redeveloped in TOPAS to incorporate geometry updates and general progress made from the previous Geant4 model.
Parameter system
TOPAS uses a parameter system and employs a modular framework to assemble and execute a simulation. Lines of code do not need to be in a particular sequence as TOPAS does not enforce strict order dependence. Parameter files must be written and read in plain text format and their functions are specified given the following command structure:
Parameter_Type : Parameter_Name = Parameter_Value
Where the Parameter_Type is the declared object type: string (s), integer (i), boolean (b), unitless double (u), dimensioned double (d) or a type of vector i.e. integer vector (iv). The Parameter_Name is a sequence of a prefix related to functionality (i.e. Ge: Geometry), the object name and property. These prefixes enable different things to be controlled with a single line command, such as the physics (Ph), scoring (Sc) particle source (So), material (Ma) and graphics (Gr) etc.
File chain structure
As more complicated applications require hundreds of parameter lines, it is logical to split up the code into several parameter files. A file will inherit and execute all lines from other files which are called by:
includeFile = anotherParameterFile.txt
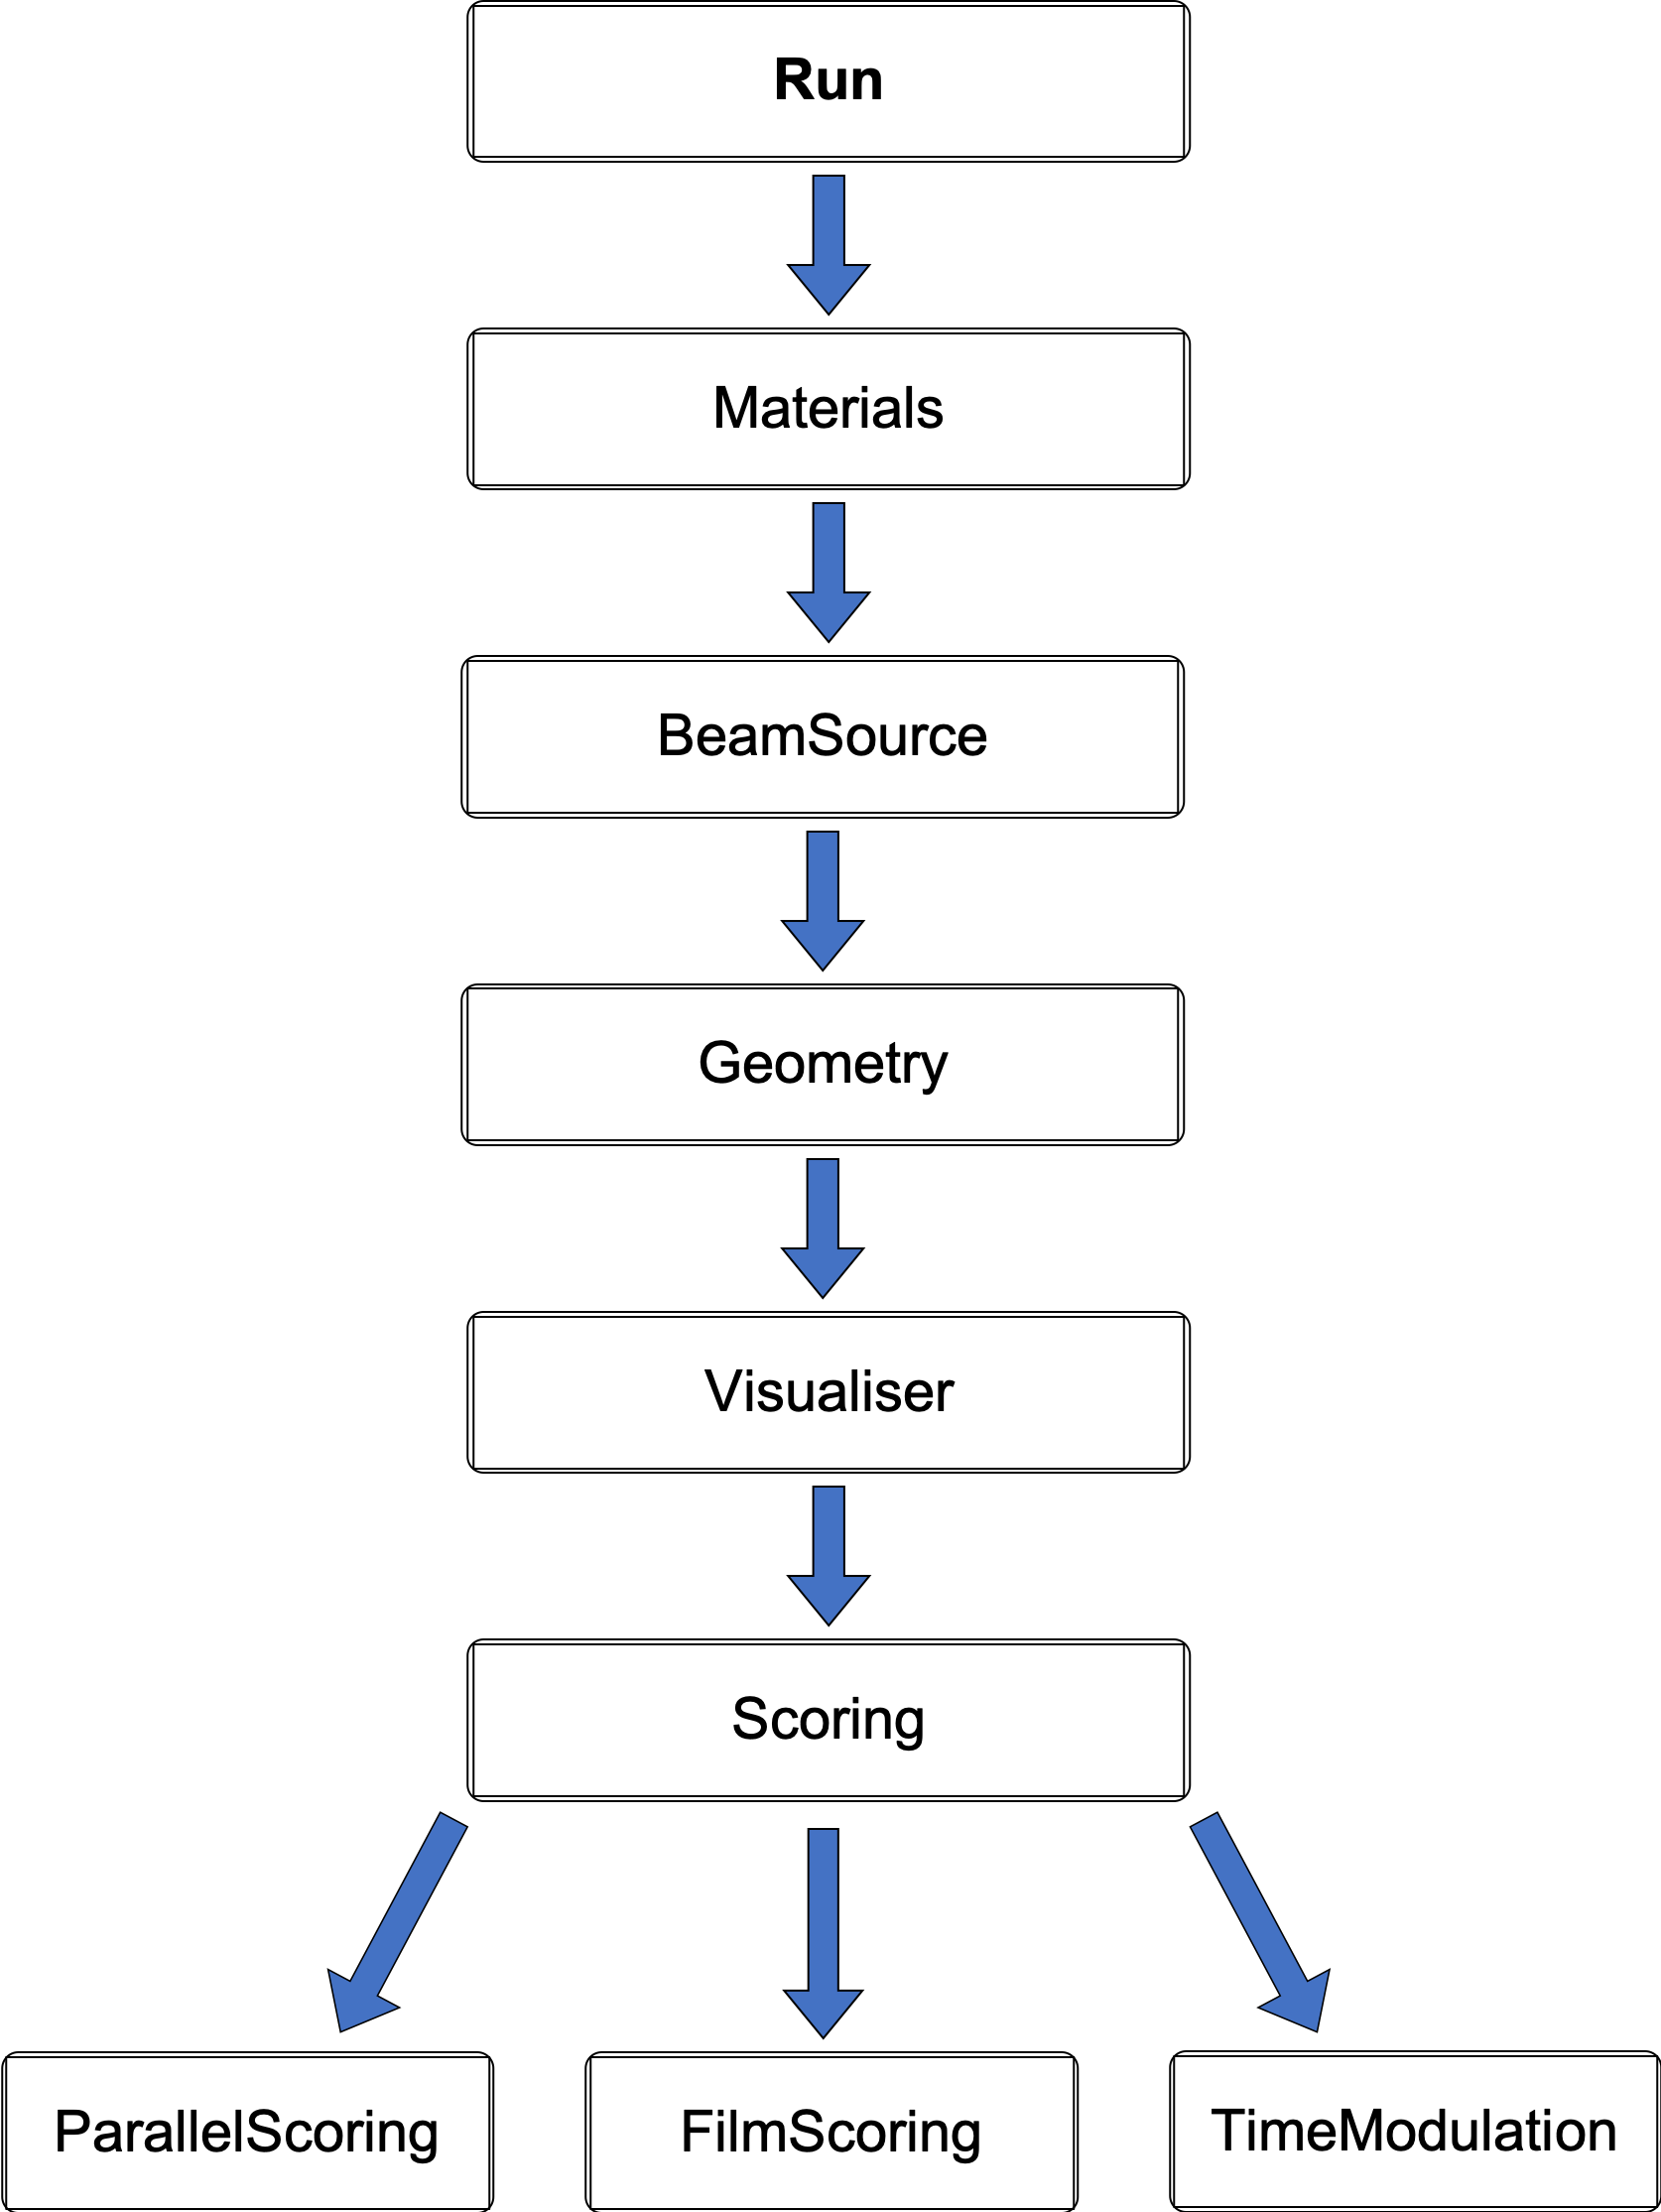
It can be useful to call another file from within the secondary parameter file where it then becomes a parameter file chain. These can span horizontally as well as vertically however the hierarchy structure must be considered as the order is important in this case. Parameter lines higher up in the chain will take precedence over the same commands further down. Moreover, to handle all the different parameters, TOPAS does not allow settings belonging to the same object to be changed in a separate chain: two different files are not able to modify the same parameter. Similarly, all components which are given the same geometry or the same scorer must be contained in the same vertical chain. Fundamentally, the main or default parameters should be defined in the initial file and then everything else that utilises these conditions should be written into adjoining files. A mostly linear hierarchical structure was adopted with interchangeable files for the scoring, this is illustrated in the diagram below.

Geometry
In general, TOPAS geometry can be described in different ways: essentially the dimensions and position must be specified with respect to the centre of their parent volume. The component name is included in each line with the stated type (shape), parent volume and material. Translational and rotational X, Y, Z parameters are assigned for positioning of the component within its mother in x, y and z. The orientation however will depend on the type of component and additional parameters may be required.
Treatment beamline
The entire delivery system is represented in the image below. This starts with the vacuum tube containing the double scattering foils, through the modulation and dosimetry box and past the patient nozzle. All the major components are labelled in the birds eye view.
- Scattering tube
- Modulation box
- Dosimetry box
- Dose monitors (front, back)
- Treatment nozzle and water phantom
To access details of the room and other measurements, click through the pages from Treatment Room Image Map.
CAD model
The geometries were built in CAD according to their exact physical dimensions which are displayed in this complete schematic. Components are exported as Stereolithography binary (STL) files which describe geometry only by their surfaces (a tessellation of triangular and quadrangular faces which approximate the volume). Although other file formats (i.e. GDML) may intrinsically include different properties such as materials or colour attributes, TOPAS does not interpret this information and each component (with their elements grouped by material) exists as an individual STL file. Furthermore, components may have their own respective axis within the world coordinate system retained during export and additional rotation or translation using parameter lines may be required. To avoid overlaps, a 0.05 mm tolerance was built between adjacents surface and components. The positions of every single element within the treatment line coordinate system are displayed in this listing. Additionally, schematics were obtained and used to model the components which were not able to be physically measured (i.e. dose monitors). These can be found with numerous photos of every component from the Clatterbridge Treatment Beamline Image Maps.
Physics settings
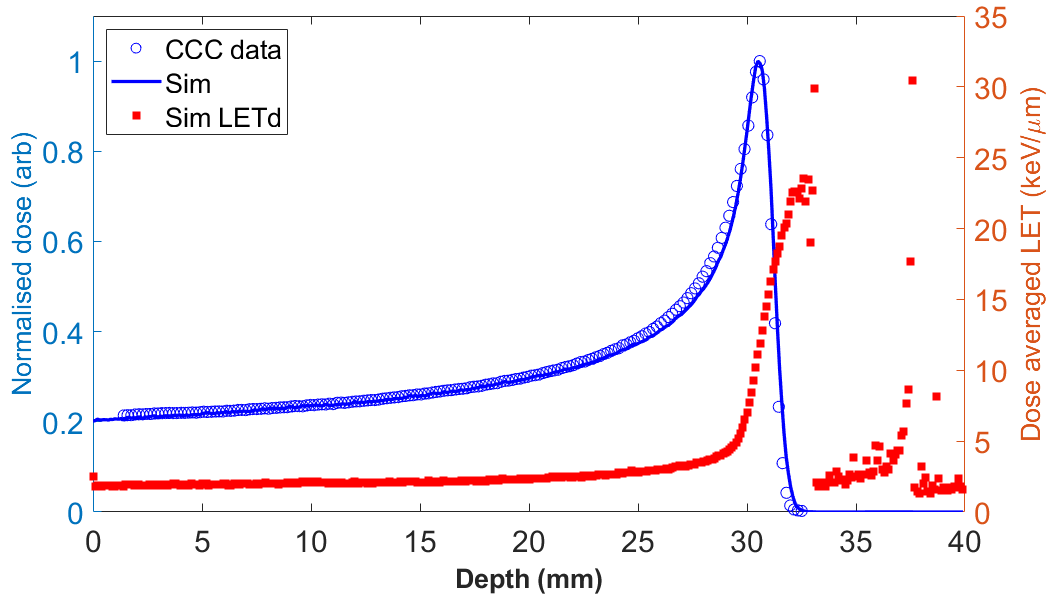
A set of QA Bragg peak measurements were used to benchmark the model and several parameters were adjusted to match the obtained BP with actual data. This flexibility is permissible as the input beam parameters (input energy, energy spread etc.) and related characteristics of the accelerator have not been recently verified by measurements. The best match was obtained with the following beam parameters:
d:So/BeamSource/BeamEnergy = 62.2 MeV
u:So/BeamSource/BeamEnergySpread = 0.53
sv:Ph/Default/Modules = 2 "g4em-standard_opt3" "g4h-phy_QGSP_BIC_HP"
d:Ph/Default/CutForElectron = 0.01 mm
d:Ph/Default/CutForProton = 0.01 mm
d:Ph/Default/CutForGamma = 0.1 mm
d:Ph/Default/CutForPositron = 0.1 mm
Particle Source
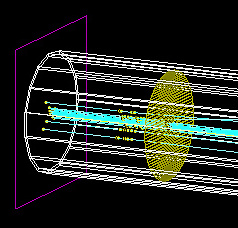
The particle source is defined in TOPAS by specifying various parameters of the beam such as the particle type, energy, shape, size, distribution and angular spread. By default, the beam is placed at the centre of the world volume and each generated primary particle is termed as a history.
Three options are written for the CCC beam. The geometrical parameters of the beam (size and angular divergence) were determined by optical modelling of the beam transport line and implemented as a Gaussian distribution for the first option. The second option, defines the beam by the obtained Twiss parameters. The third option enables a particle source to be generated from a phase space file (PhaseSpaceSource_100k.phsp is provided to generate a beam of 100k protons at the origin).
- BeamSource (default, standard monoenergetic beam)
- BeamSourceTwiss (Gaussian beam defined by Twiss parameters)
- BeamSourcePhase (input beam from phase space file)
Phase space inputs
For phase space files, it is important that the format follows the TOPAS header syntax and includes the following properties:
Columns of data are as follows:
 1: Position X [cm]
 2: Position Y [cm]
 3: Position Z [cm]
 4: Direction Cosine X
 5: Direction Cosine Y
 6: Energy [MeV]
 7: Weight
 8: Particle Type (in PDG Format)
 9: Flag to tell if Third Direction Cosine is Negative (1 means true)
10: Flag to tell if this is the First Scored Particle from this History (1 means true)
The origin (source plane) of the beam is shown below by the purple rectangle at the start of the scattering tube.
Scoring
TOPAS scores particles using two main scoring classes: volume and surface scorers. Quantities such as the dose, energy deposition, fluence, charge and LET can be determined for different components and materials. There are more scoring options for volumes and often the same information can be obtained (although may be output in a different form) by using different scorers with the appropriate settings or filters. There are also other extended scorers available including an RBE scorer and it is also possible for users to write their own.
Volume scorers
Dose deposition
To score the dose deposition and generate a BP, a 40 x 40 x 40 mm3 water phantom was created at isocentre. Scored quantities are contingent on the geometry of the applicable component and the resolution is designated by the number of bins in the respective axis.
Linear energy transfer
The LET could be determined using the prebuilt ProtonLET scorer, weighted by either the average dose or track. For LETd, the energy deposition from both primary, secondary protons and electrons are taken over each step.
Surface scorers
Transverse beam profiles
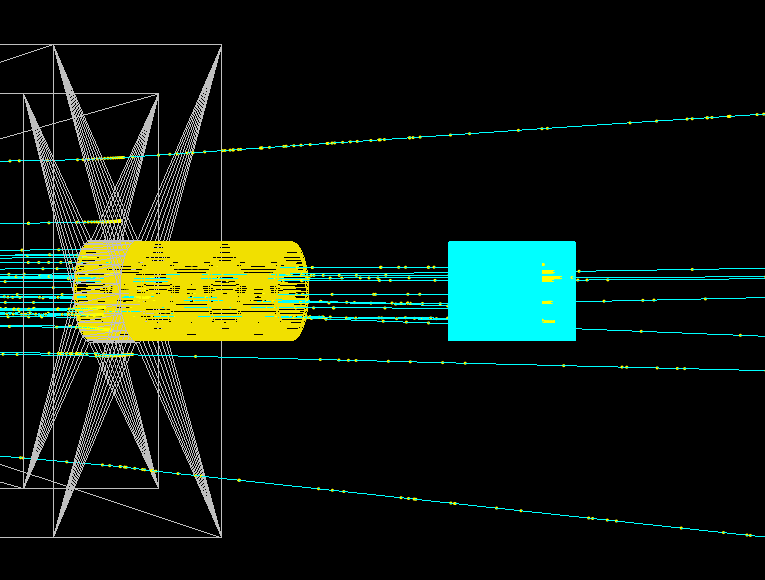
Distributions of the beam in the transverse plane can illustrate the accuracy of the simulation model and are useful to characterise the beam along the treatment line. Multiple pieces of EBT3 film (volume with a 28 um sensitive lucite layer) were defined in the model (red squares) as shown below.
Running the simulation
The simulation has been updated for compatibility with TOPAS v3.6.1 and can be cloned from this Github repository. It is not necessary to install Geant4 to run TOPAS, instructions are listed on the readme.
Parameter files
The directory contains the following (.txt) parameter files as necessary to run the simulation:
- Run
- BeamSource
- Materials
- Scoring
- Geometry
- Visualiser
Optional:
- TimeModulation
- ParallelScoring
- FilmScoring
Note:
Visualiser: The model geometry can be easily visualised as the most recent version of TOPAS now enables an interactive Qt viewer.
Output
Analysis
Matlab scripts to plot the BP and LETd alongside CCC data as well as the transverse beam profile as shown below, are included in the /data/analysis directory.
Dose profiles
Additional capabilities
- Incorporation of information from particle transport codes
- TOPAS-nBIO extensions


